Find the area under the standard normal curve between z = 1.5 and z = 2.5
Solution:
The normal distribution is defined by the probability density function f(x) for the continuous random variable X considered in the system.
It is a function whose integral across an interval (say x to x + dx) gives the probability of the random variable X, by considering the values between x and x + dx.
A Z-score chart, often called a Z-Table, is used to find the area under a normal curve, or bell curve, for a binomial distribution.
The Z score itself is a statistical measurement of the number of standard deviations from the mean of a normal distribution.
Using the z-chart table
When z = 1.5,
we see that z = 0.9332
When z = 2.5,
we see that z = 0.9938
By subtracting both we can find the area under the standard normal distribution curve
Area = 0.9938 - 0.9332
= 0.0606
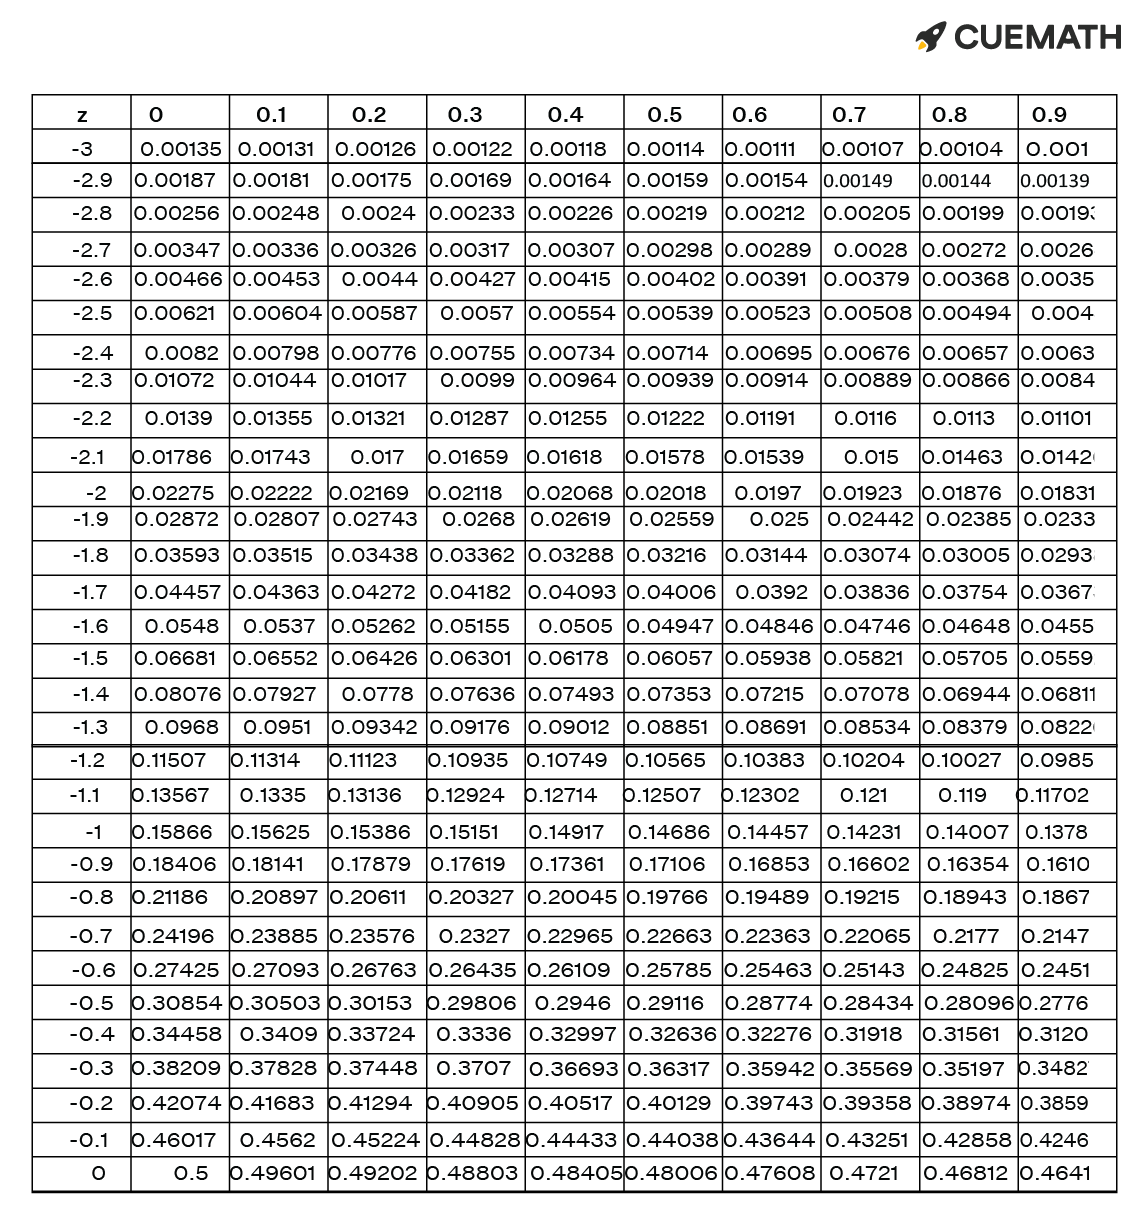
Therefore, the area under the standard normal curve is 0.0606
Find the area under the standard normal curve between z = 1.5 and z = 2.5
Summary:
The area under the standard normal curve between z = 1.5 and z = 2.5 is 0.0606