Right Skewed Histogram
A histogram in which most of the data falls to the right of the graph's peak is known as a right-skewed histogram. It is also known as a positively skewed histogram. A right-skewed histogram has a definite relationship between its mean, median, and mode which can be written as mean > median > mode. Let us learn more about it in detail in this article.
| 1. | What is a Right Skewed Histogram? |
| 2. | Right Skewed Histogram Mean Median Mode |
| 3. | Right Skewed Histogram Vs Left Skewed |
| 4. | FAQs on Right Skewed Histogram |
What is a Right Skewed Histogram?
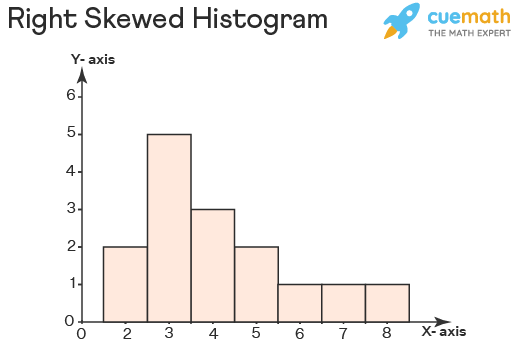
A right-skewed histogram or a positively skewed distribution is a type of histogram that is not symmetrical and in which the peak of the graph lies to the left of the middle value or the median. Let us draw a histogram showing the given data: 2, 3, 3, 4, 3, 8, 3, 3, 2, 5, 7, 4, 5, 4, 6.

When we draw a histogram showing the above data, we found that it is skewed to the right. Or we can say that a portion of the right side seems to be chopped or cut off. This is an example of a right-skewed histogram. Now, let us learn about the relation between mean, median, and mode of a right-skewed histogram in the next section.
Right Skewed Histogram Mean Median Mode
Before learning about the mean, median, and mode of a right-skewed histogram, let us quickly go through the meaning of these terms:
Mean: It is the average of the data found by dividing the sum of the observations by the total number of observations.
Median: It is the middle value of the data or the observation that lies in the mid or center of all the given values.
Mode: It is the most frequently occurred observation in the data. For example, in the above example, 3 is the mode as it has occurred 5 times which is the maximum as compared to the other values.
In a histogram skewed to the right, the value of mode is to the left of the value of the median as in a right-skewed histogram the peak of the graph (mode) occurs to the left of the center of the graph (median). And, most of the values or observations fall on the right side of the graph, therefore the value of mean comes to the right of the center or the median of the right-skewed histogram distribution. Therefore, the relation between the mean, median, and mode of a right-skewed histogram is given as Mean > Median > Mode. In other words, we can say that in such a histogram, the value of mean is the highest followed by the value of median and then the mode.

Observe the graph of a right-skewed histogram given above representing its mean, median, and mode.
Right Skewed Histogram Vs Left Skewed
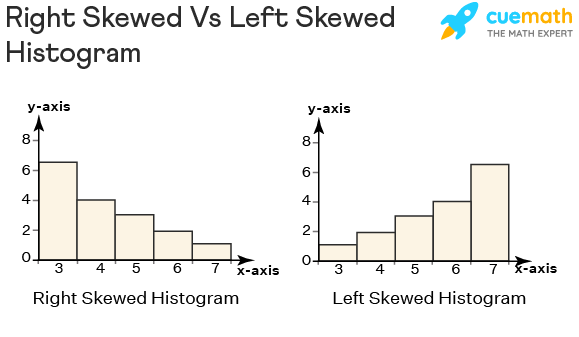
There are three types of histogram possible based on its skewness which are symmetrical histogram, right-skewed histogram, and left-skewed histogram. Let us do an activity to understand the difference between the right-skewed and left-skewed histogram. Draw a histogram to represent the following data: 5, 3, 3, 6, 4, 3, 5, 4, 7, 3, 3, 5, 3, 6, 4, 3, 4, and then draw a histogram to represent the following data: 7, 4, 6, 7, 5, 7, 6, 3, 4, 7, 5, 6, 6, 7, 7, 5, 7. Observe the two histograms given below to represent each of the above data sets.

The first data is taking a form of a right-skewed histogram, while the second data is taking the form of a left-skewed histogram. Let us learn some basic differences between a right-skewed histogram and a left-skewed histogram in the table below.
| Right Skewed Histogram | Left Skewed Histogram |
|---|---|
| Also known as a positively skewed histogram. | Also known as a negatively skewed histogram. |
| The relation between right skewed histogram mean, median, and mode is Mean > Median > Mode. | The relation between mean, median, and mode in a left-skewed histogram is Mean < Median < Mode. |
| The peak of the graph lies on the left side of the center. | The peak of the graph lies on the right side of the center. |
► Related Articles
Check these interesting articles related to the concept of a right-skewed histogram in statistics.
Right Skewed Histogram Examples
-
Example 1: Draw a right-skewed histogram to represent the following data: 9, 7, 8, 7, 6, 7, 8, 10, 8, 7, 6, 8, 8, 7, 10, 6, 7, 7, 8, 9, 6, 7.
Solution: To represent the given data, the histogram skewed to the right is shown below:

-
Example 2: What is the mode of the right-skewed histogram given in Example 1?
Solution: The mode of a right-skewed histogram can be found out by looking at the peak of the graph. In the given histogram, the value of mode is 7 as it is the most repetitive observation.

FAQs on Right Skewed Histogram
What does a Right-Skewed Histogram Mean?
A histogram skewed to the right means that the peak of the graph lies to the left side of the center. On the right side of the graph, the frequencies of observations are lower than the frequencies of observations to the left side.
What does a Right-Skewed Histogram Look Like?
A right-skewed histogram looks like a graph that reaches the maximum point of its slope before the center point of the graph. It looks like a slope that moves up fastly, and then gradually moves down towards the x-axis. The mode of the right-skewed histogram is smaller than its median and mean, and lies to the left of the median.
How do you Interpret a Right-Skewed Histogram?
The right-skewed histogram interpretation is done by looking at the values of its mean, median, and mode. The peak of the graph or the mode lies to the left of the median or the center of the right-skewed histogram.
What is the Center of a Right-Skewed Histogram?
If the histogram is skewed to the right, then the median shows the center of the histogram. It lies between the mean and the mode.
What Makes a Histogram Skewed Right?
In a right-skewed histogram, the frequency of observation lies to the left is the highest and most of the observations or data points lie to the right of the graph which makes it a positively skewed histogram or a right-skewed histogram. This type of histogram reaches its peak point in one of the initial values only and the tail of the graph is usually extended having low frequencies.
visual curriculum
