Graphing Functions
Graphing functions is the process of drawing the graph (curve) of the corresponding function. Graphing basic functions like linear, quadratic, cubic, etc is pretty simple, graphing functions that are complex like rational, logarithmic, etc, needs some skill and some mathematical concepts to understand.
Let us see the process of graphing functions along with examples.
| 1. | What is Meant By Graphing Functions? |
| 2. | Graphing Basic Functions |
| 3. | Graphing Complex Functions |
| 4. | Graphing Functions by Transformations |
| 5. | FAQs on Graphing Functions |
What is Meant By Graphing Functions?
Graphing functions is drawing the curve that represents the function on the coordinate plane. If a curve (graph) represents a function, then every point on the curve satisfies the function equation. For example, the following graph represents the linear function f(x) = -x+ 2.
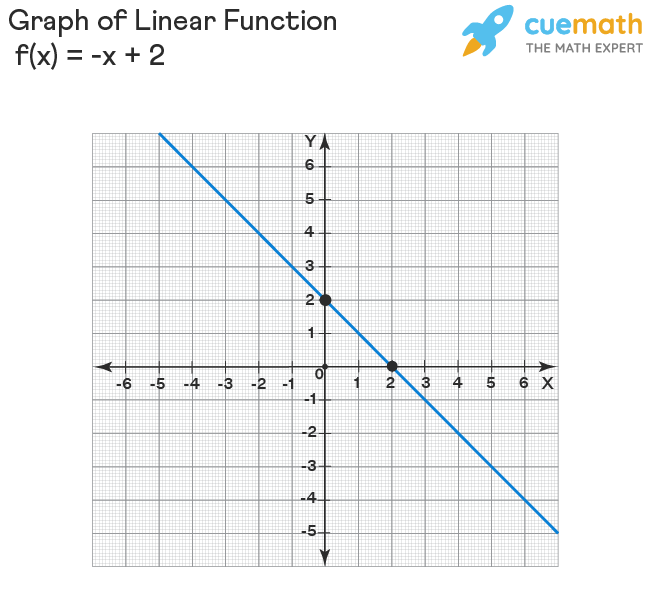
Take any point on this line, say, (-1, 3). Let us substitute (-1, 3) = (x, y) (i.e., x = -1 and y = 3) in the function f(x) = -x + 2 (note that it can be written as y = -x + 2). Then
3 = -(-1) + 2
3 = 1 + 2
3 = 3, thus, (-1, 3) satisfies the function.
In the same way, you can try taking different points and checking whether they satisfy the function. Each and every point on the line (in general called "curve") satisfies the function. Drawing such curves representing the functions is known as graphing functions.
Graphing Basic Functions
Graphing basic functions like linear functions and quadratic functions is easy. The basic idea of graphing functions is
- Identifying the shape if possible. For example, if it is a linear function of the form f(x) = ax + b, then its graph would be a line; if it is a quadratic function of the form f(x) = ax2 + bx + c, then its a parabola.
- finding some points on it, by substituting some random values of x and finding the corresponding values of y by substituting each value into the function.
Here are some examples.
Graphing Linear Functions
Let us graph the same linear function as mentioned in the previous section (f(x) = -x + 2). For this, we create a table of values by taking some random numbers for x say x = 0 and x = 1. Then substitute each of these in y = -x + 2 to compute y-values.
| x | y |
|---|---|
| 0 | -0 + 2 = 2 |
| 1 | -1 + 2 = 1 |
Thus, two points on the line are (0, 2) and (1, 1). If we plot them on a graph and join them by a straight line (extending the line on both sides), we get its graph as shown in the previous section.
Graphing Quadratic Functions
For graphing quadratic function also, we can find some random points on it. But this may not give a perfect U-shaped curve. This is because, to get a perfect U-shaped curve, we need where the curve is turning. i.e., we have to find its vertex. After finding the vertex, we can find two or three random points on each side of the vertex and they would help in graphing the function.
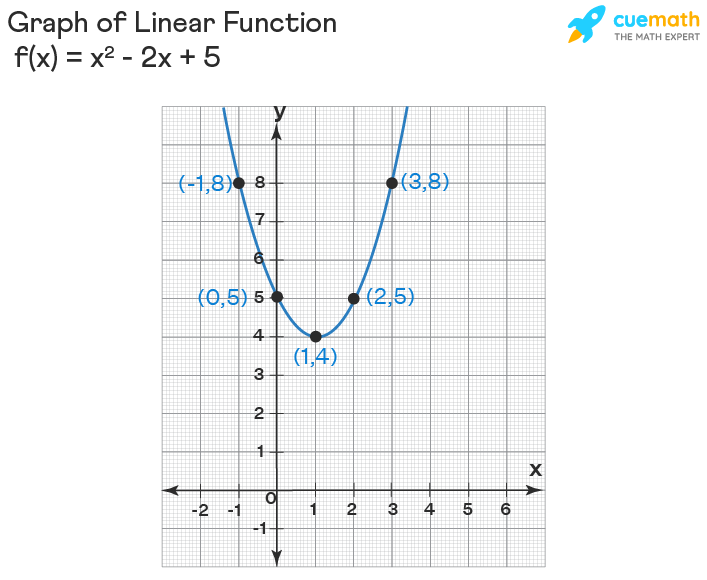
Example: Graph the quadratic function f(x) = x2 - 2x + 5.
Solution:
Comparing it with f(x) = ax2 + bx + c, a = 1, b = -2, and c = 5.
The x-coordinate of the vertex is, h = -b/2a = -(-2)/2(1) = 1.
Its y-coordinate is, f(1) = 12 - 2(1) + 5 = 4.
Hence, the vertex is (1, 4).
We will take two random numbers on each side of 1 (which is the x-coordinate of the vertex) and frame a table. Then we can calculate the y-coordinates using the function.
| x | y |
|---|---|
| -1 | (-1)2 - 2(-1) + 5 = 8 |
| 0 | 02 - 2(0) + 5 = 5 |
| Vertex: 1 | 4 |
| 2 | 22 - 2(2) + 5 = 5 |
| 3 | 32 - 2(3) + 5 = 8 |
Now, we will plot the points (-1, 8), (0, 5), (1, 4), (2, 5), and (3, 8) on a graph sheet, join them, and extend the curve on both sides.
Graphing Complex Functions
Graphing functions is comparably simple if each of their domain and range is the set of all real numbers. But it is NOT the case with all types of functions. There are some complex functions for which domain, range, asymptotes, and holes have to be taken care of while graphing them. The most popular such functions are:
- Rational functions - Its parent function is of the form f(x) = 1/x (which is called the reciprocal function).
- Exponential functions - Its parent function is of the form f(x) = ax.
- Logarithmic Functions - Its parent function is of the form f(x) = log x.
Just have an idea of what the graphs of parent functions of each of these functions look like.

In each of these cases, for graphing functions, we follow the following steps:
- Find the domain and range of the function and keep it in mind while drawing the curve.
- Find x-intercept(s) and y-intercept(s), and plot them.
- Identify the holes if any.
- Find the asymptotes (vertical, horizontal, and slant) and draw them by dotted lines so that we can break the graph along those lines and make sure that the graph doesn't touch them.
- Construct a table of values by taking some random numbers for x (on both sides of x-intercept and/or on both sides of the vertical asymptote), calculate the corresponding values of y.
- Plot the points from the table, and join them by taking care of asymptotes, domain, and range.
Let us see how to graph a function in different cases using the above steps.
Graphing Rational Functions
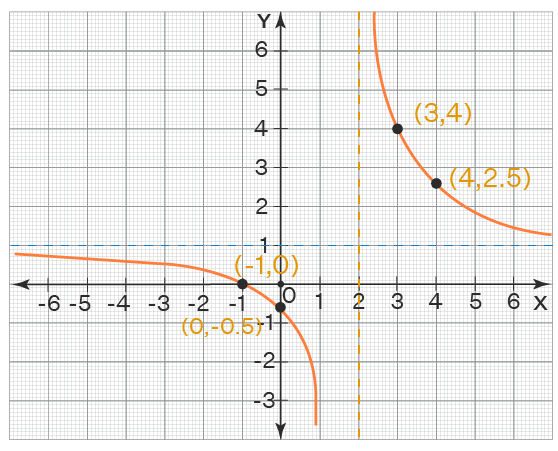
Let us graph a rational function f(x) = (x + 1) / (x - 2). We follow the above steps and graph this function.
- Domain = {x ∈ R | x ≠ 2} ; Range = {y ∈ R | y ≠ 1}. To understand how to find the domain and range of a rational function, click here.
- Its x-intercept is (-1, 0) and y-intercept is (0, -0.5).
- There are no holes.
- Vertical asymptote (VA) is x = 2 and horizontal asymptote (VA) is y = 1.
- Let us take some random values on both sides of the vertical asymptote x = 2 and calculate the respective y-values.
x y -1 (-1+1)/(-1-2) = 0 (x-int) 0 (0+1)/(0-2) = -0.5 (y-int) 2 VA 3 (3+1)/(3-2) = 4 4 (4+1)/(4-2) = 2.5 - Let us plot all these points along with VA and HA.
Graphing Exponential Functions
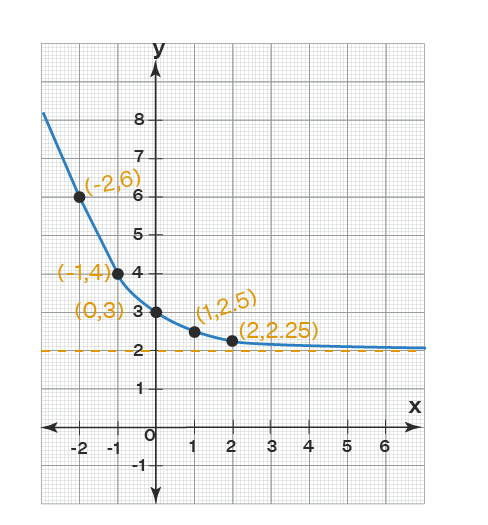
Consider an exponential function f(x) = 2-x + 2. We will graph it using the same steps as mentioned above.
- Its domain is the set of all real numbers (R) and its range is y > 2. To know how to find these, click here.
- It has no vertical asymptotes. But it has a horizontal asymptote at y = 2.
- It has no x-intercepts. Its y-intercept is (0, 3).
- No holes.
- We do not have data about VA or x-intercept. We only have one data so far which is (0, 3). So let us take some random numbers on both sides of x = 0 and frame a table.
x y -2 2-(-2) + 2 = 6 -1 2-(-1) + 2 = 4 0 3 (y-int) 1 2-1 + 2 = 2.5 2 2-2 + 2 = 2.25 - Let us plot all the information on the graph.
Graphing Logarithmic Functions
We will graph a logarithmic function, say f(x) = 2 log2 x - 2. We will graph it now by following the steps as explained earlier.
- Its domain is x > 0 and its range is the set of all real numbers (R). To understand this, click here.
- Its x-int is (2, 0) and there is no y-int.
- Its vertical asymptote is y = 0 (x-axis) and no horizontal asymptote.
- No holes.
- We have only one reference point so far which is (2, 0). We will construct a table by taking a few random numbers on either side of 0 (we cannot choose values of x less than 0 as the domain is x > 0).
x y 1 2 log2 1 - 2 = -2 2 0 (x-int) 4 2 log2 4 - 2 = 2 Note that we have chosen such numbers for x that are easy to simplify the y-values.
- We have only one reference point so far which is (2, 0). We will construct a table by taking a few random numbers on either side of 0 (we cannot choose values of x less than 0 as the domain is x > 0).
-
We will plot the graph now.
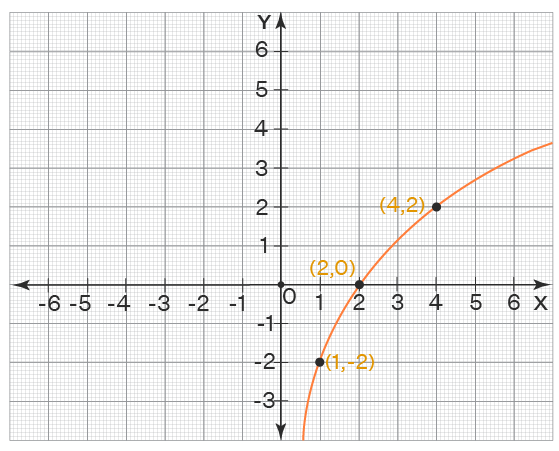
Similarly, you can see how to graph non-linear functions, identity function, modulus function, polynomial functions, zero function, greatest integer function, constant function, trigonometric functions, fractional part function, etc, by clicking on the respective links.
Graphing Functions by Transformations
We can graph the functions by applying transformations on the graphs of the parent functions. Here are the parent functions of a few important types of functions.
- Linear function: f(x) = x
- Quadratic function: f(x) = x2
- Cubic functions: f(x) = x3
- Square root function: f(x) = √x
- Cube root function: f(x) = ∛x
- Absolute value function: f(x) = |x|
- Reciprocal function: f(x) = 1/x
- Exponential function: f(x) = ax, 0 < a < 1
- Logarithmic function: f(x) = log x
We need to have an idea about how the graph of each of these parent functions looks like (by clicking on the respective links). Then we can apply the following transformations to graph the given function.
| Transformation | Change in Graph |
|---|---|
| f(x) + c | It shifts the graph of the function c units upward. |
| f(x) - c | It shifts the graph of the function c units downward. |
| f(x + c) | It shifts the graph of the function c units to the left. |
| f(x - c) | It shifts the graph of the function c units to the right. |
| -f(x) | It reflects the graph of the function in the x-axis (upside down). |
| f(-x) | It reflects the graph of the function in the y-axis (i.e., the left and right sides are swapped). |
| f(ax) | Horizontal dilation by a factor of 1/a. |
| a f(x) | Vertical dilation by a factor of a. |
To understand how to graph the functions by using transformations in detail, click here.
Important Notes on Graphing Functions:
- f(ax) ≠ a f(x). Both may have different values.
- The value of x used to plot any function f(x) can be a whole number, real number, or decimal number.
- The graph of a function should never touch the asymptotes.
- Do not choose the values of x in the table that are NOT there in the domain of the function.
☛ Related Topics:
Graphing Functions Examples
-
Example 1: Determine which of the following points lie on the graph of function f(x) = 2x3 - 2? (a) (1, 1) (b) (1, 0) (c) (2, 6).
Solution:
We will substitute each point in the given function to see which of them satisfies the function.
(a) (1, 1) = (x, f(x))
1 = 2(1)3 - 2
1 = 2 - 2
1 = 0, not satisfiedSo (1, 1) is NOT on the graph of the function.
(b) (1, 0) = (x, f(x))
0 = 2(1)3 - 2
0 = 2 - 2
0 = 0, satisfiedSo (1, 1) is on the graph of the function.
(c) (2, 6) = (x, f(x))
6 = 2(2)3 - 2
6 = 16 - 2
6 = 14, not satisfiedSo (2, 6) is NOT on the graph of the function.
Answer: Only (b) lies on the given function.
-
Example 2: Does the graph given in Example 1 has any asymptotes? Explain. How many parts does it have?
Solution:
The given function is f(x) = 2x3 - 2, which is a polynomial function and hence it has no asymptotes.
When there are no asymptotes, we will get only one curve (as the curve doesn't break anywhere) while graphing functions.
Answer: No asymptotes and only one curve.
-
Example 3: Draw the graph of the function given in Example 1 along with the point(s) you found from its solution.
Solution:
In Example 1, we have already found that (1, 0) lies on the function f(x) = 2x3 - 2. For graphing functions, we need more points. Let us construct a table for the same.
x y -1 2(-1)3 - 2 = -4 0 2(0)3 - 2 = -2 Let us plot these points along with (1, 0) and plot it.
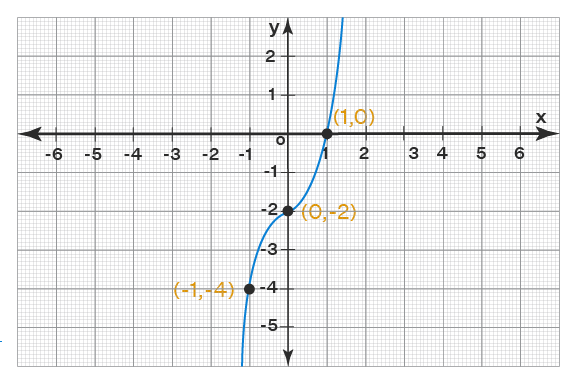
Answer: The graph is drawn.

FAQs on Graphing Functions
How to Graph Functions?
For graphing functions, we need to plot its asymptotes, its x and y-intercepts, holes, and a few points on it by constructing a table of values. Then just join the point by not touching the asymptotes and keeping a note of the domain and range of the function.
What are the Steps in Graphing a Linear Function?
The steps to graph a linear function are given as follows:
- Make sure the linear function is of the form y=mx+b.
- Now, b is plotted on the y-axis.
- m is converted into a fraction.
- Now the line is extended from b using the slope.
- The line can further be extended using m as a guiding factor.
Alternatively:
Any two points on a line determine the line. So to graph a linear function, we just need two points on it. To graph it, just construct a table of values with two columns x and y, take some random numbers for x, and calculate the corresponding values of y by substituting each of them in the function. Then just plot the points on a graph, join them by a line, and extend the line on both sides infinitely.
How Do You Graph a Piecewise Function?
A piecewise function is defined in different ways (using different equations) in different intervals. We just have to consider each equation as a different function on the given domain and graph it just like how we graph a normal function. To understand more about graphing a piecewise function, click here.
How to Identify Identify Functions Using Graphs?
Here are a few tricks to identify the functions from graphs:
- If the graph is a line, then it is a linear function and is of the form f(x) = ax + b.
- If the graph is a perfect U or inverted U shaped, then it is a quadratic function and is of the form f(x) = ax2 + bx + c.
- If the graph has two curves that are symmetric about a slanting line then its a rational function and is of the form f(x) = (ax + b) / (cx + d) usually.
- If the graph is V or inverted V shaped then its an absolute value function and is of the form f(x) = a |bx + c| + d.
- If the graph has multiple horizontal line pieces, then it represents a floor function or ceiling function.
- If a graph with a single curve is increasing or decreasing having a vertical asymptote, then it is a logarithmic function.
- If a graph with a single curve is increasing or decreasing having a horizontal asymptote, then it is an exponential function.
- If the graph has multiple waves, that may be one of the trigonometric functions:
Sine function
Cosine function
Tangent function
Cosecant function
Secant function
Cotangent function
How Do You Know If the Graph is a Function?
A function always passes the vertical line test. To use this test, just take a vertical line (or just a vertical stick) and make it pass through the graph from left to right horizontally. At no point in time, the line shouldn't intersect the graph at more than one point for the graph to represent a function.
How do you Use a Graph to Solve an Equation?
First, identify the type of the function by looking at the graph. Take its general equation. Use some points on the graph and the general equation to determine the exact equation of the function.
How do you Sketch a Graph of an Equation?
To sketch a graph of an equation of a function, do the following:
- Plot various points for the equation.
- Join the points and form the curve. The curve so obtained is a graph of the given equation.
visual curriculum