Applying modulus
The following figure shows the graph of the function \(f\left( x \right) = {x^2} - 5x+ 4\):
Using this graph, can we plot the graph of \(y = g\left( x \right) = \left|{f\left( x \right)} \right|\)? The answer is simple: wherever f is positive, we leave the curve untouched; wherever f is negative, we reflect that part in the x-axis, because the effect of the modulus operation is to give us the positive magnitude. In this case, the graph of \(y = \left| {f\left( x \right)} \right|\) will be as follows:
Thus, the part of the curve below the x-axis in the original graph gets reflect in the x-axis.
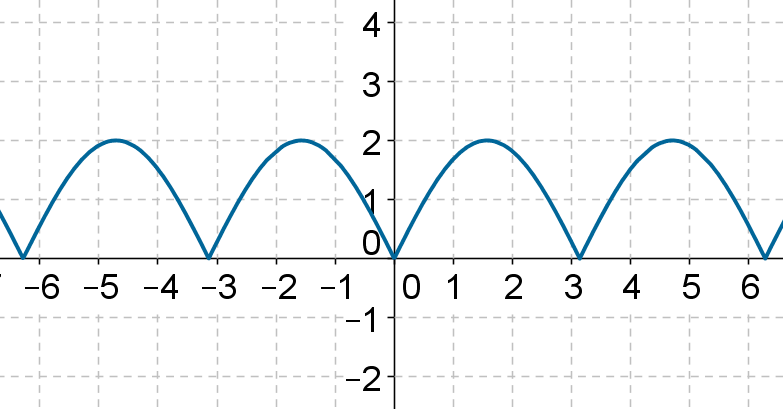
Let’s see another example of this transformation. The following is the graph of \(y= f\left( x \right)\), where f is some arbitrary function:
And, the following is the graph of \(y = \left| {f\left( x \right)} \right|\):
- Live one on one classroom and doubt clearing
- Practice worksheets in and after class for conceptual clarity
- Personalized curriculum to keep up with school


