SSAT Scores and ISEE Scores: What the Report Means
The two reports use different scales, and neither comes with a passing mark. On either report, the percentile compares your child with other private-school applicants, not a whole school population, so it can read lower than the percentiles you are used to.

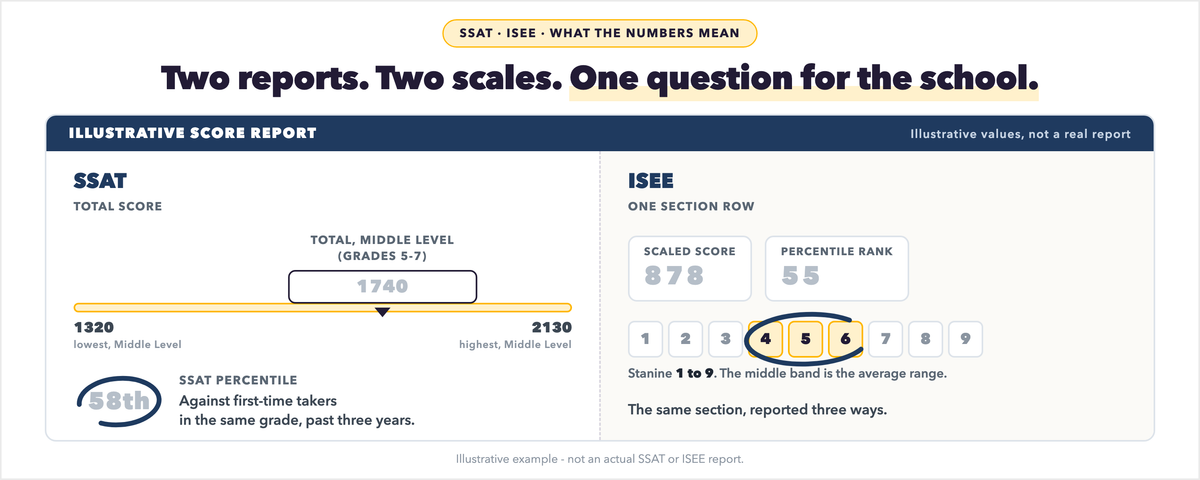
The two reports use different scales, and neither comes with a passing mark. An SSAT report gives a scaled score per section and a total (Middle Level, grades 5 to 7: 1320 to 2130; Upper Level, grades 8 to 11: 1500 to 2400; the Elementary Level total is in the table below), plus a percentile against first-time test takers in the same grade over the last three years. An ISEE report gives each section a scaled score on one scale, 760 to 940, a percentile rank against all same-grade takers over the past three years, and a stanine from 1 to 9. On either report, the percentile compares your child with other private-school applicants, not a whole school population, so it can read lower than the percentiles you are used to. On both tests the test maker answers "is it good enough?" the same way: ask the school. So the one action this report asks of you is a call to each admissions office with one question: what score range did you admit last year? That is step 2 below.
What the SSAT report shows
The report opens with two totals. "Your Score" is the total scaled score, drawn on a line from the lowest to the highest possible score, with the average score for your child's grade printed beside it. The total percentile next to it compares your child with first-time test takers in the same grade over the last three years, in the US and Canada. The test maker publishes no table for turning a scaled score into a percentile, not on either score-report page and not in its help articles on reading the report, so the percentile printed on your report is the only one there is.
Each section (verbal, quantitative, reading) then shows its own scaled score, percentile and the average score for the grade, plus a score range, which shows where your child would likely land on a retest with a different version of the test. A small table counts the questions answered correctly, incorrectly and not at all.
The scales change by level, and the level follows your child's grade. The Middle Level covers grades 5 to 7: the test maker's sample report prints sections from 440 to 710 and a total from 1320 to 2130. The Upper Level covers grades 8 to 11: its sample prints 500 to 800 and 1500 to 2400. The Elementary Level covers grades 3 and 4: sections run 300 to 600 (mean 450) and the total 900 to 1800 (mean 1350). On the Middle and Upper Levels, a wrong answer costs a quarter point and a skipped question costs nothing; the Elementary Level has no penalty. The writing sample is not scored on any level.
What the ISEE report shows
The Individual Student Report puts every section on one scale, 760 to 940. The scaled score is worked out from the number of correct answers, so that different versions of the test read alike. Lower, Middle and Upper Level reports carry four scored sections; Primary 2, 3 and 4 reports carry two. The essay is not scored; the schools you share scores with receive it, and you do not.
The ISEE level follows the grade your child is applying to, not the grade they are in now. Primary 2, 3 and 4 are for applicants to grades 2, 3 and 4. Lower Level is for grades 5 and 6. Middle Level is for grades 7 and 8. Upper Level is for grades 9 to 12. Our page on the ISEE by level sets out what each level asks.
Each scaled score comes with a percentile rank and a stanine. The percentile rank is the share of students, 1 to 99, who scored the same or lower, against all students in that grade who took the ISEE during the past three years. The stanine folds the percentile into nine bands, 1 lowest to 9 highest. Stanines 4, 5, and 6 together cover the middle 54 percent of takers; 1 to 3 the bottom 23 percent; 7 to 9 the top 23 percent. The Stanine Analysis graph shades one stanine on either side of the result, so a 5 is drawn as a band from 4 to 6, because a retake can move the number even when the child's ability has not changed. Read the band, not the point.
Why the percentile looks lower than school tests
Both tests compare your child with other applicants to independent schools. The test maker's ISEE page says that group is generally of higher ability than the overall student population, so a section result can appear considerably lower than what you are used to seeing. The SSAT's sample report says the same: its takers are a small and highly competitive group. The two percentiles do not convert to each other either: the SSAT counts first-time takers only, the ISEE all takers.
| SSAT | ISEE | |
|---|---|---|
| Section scale | 300 to 600 (Elementary Level), 440 to 710 (Middle Level), 500 to 800 (Upper Level) | 760 to 940, every level |
| Total score | 900 to 1800 (Elementary Level, grades 3-4), 1320 to 2130 (Middle Level, grades 5-7), 1500 to 2400 (Upper Level, grades 8-11) | None; sections reported separately |
| Percentile compares with | First-time takers, same grade, last three years, US and Canada | All takers, same grade, past three years |
| Stanine | None | 1 to 9, with a shaded band of one stanine on either side |
| Retest range | A score range is printed per section | The stanine band does this job |
| Wrong answers | Cost a quarter point on the Middle and Upper Levels; no penalty on the Elementary Level | Scored on correct answers only |
| Scores usually ready | Paper about two weeks; SSAT at Home the Wednesday after the test | Online three to five days; paper five to ten days |
For the ideas behind the quantitative sections, Cuemath's free math concept explanations go one concept at a time.
The bar belongs to the school, and you have to ask for it
The test maker publishes no "good score." The SSAT's guidance is to focus on the scaled score, use the percentile for context, and speak with the schools. Every school weighs scores differently, and most say they look at the whole applicant. The ISEE's page ends the same way: for how a school will read the scores, contact that school's admissions office.
Our file of 49 private schools' requirements records which test each school asks for where the school says so; it holds no admitted-score ranges.
Sending and retesting
You decide who gets the scores on both tests. SSAT families can wait until scores arrive before naming a school, and a school receives scores only for the test dates you designate for it. ISEE families can add a school at no extra fee after seeing the report, but cannot remove one after the test date, and only the complete report goes out.
Before you book a retake, read the score range on the report. The SSAT's sample reports say that range covers the small differences you would expect from a different edition of the test, so a second score inside the range has told you nothing new. The ISEE allows one test per testing season, and the seasons are Fall for August to November, Winter for December to March, and Spring or Summer for April to July. Count those months against a January 15 deadline before you register. The FAQs below hold the rest of the retake and timing details.
What to do this week
Step 2 is the one that matters.
- Read the scaled score first, then the percentile. On the SSAT, note the average score for the grade printed beside each score. On the ISEE, read the stanine band, not the single number.
- Call each admissions office and ask what score range they admitted last year, and whether they use scores again for course placement.
- Decide who gets the scores. SSAT: name schools only for the test dates you want them to see. ISEE: if you are keeping this report, add the schools now.
- If a retest is on the table, check the testing seasons (ISEE) or the release schedule (SSAT) against each school's deadline before you register.
A score already reported will not change on its own. A free Cuemath MathFit evaluation is a live one-on-one session that shows where your child's reasoning and fluency stand against grade level, and where a gap sits. It tells you what the quantitative sections were measuring, whether or not there is a second test.
Know where your child's math reasoning stands before the next test date
A free Cuemath MathFit evaluation is a live, one-on-one session that shows where your child's reasoning and fluency stand against grade level and where a gap sits.
Book a Free EvaluationFor students in Grades K to 12.
FAQs
What is a good SSAT score?
There is no published one. The test maker's advice is to focus on the scaled score, which means the same thing year to year, and use the percentile for context. Your report prints the average score for your child's grade next to each scale, so you can see at a glance whether the score is above or below average. Whether that is enough is each school's own call. The test maker's own advice is to speak with the school. Some schools may give you a range and some may not, so ask, and ask early.
What is a good ISEE stanine?
No bar is published for that either. Stanines 4, 5 and 6 hold the middle 54 percent of ISEE takers, 7 to 9 the top 23. Remember who is in the group: other independent-school applicants, whom the test maker describes as generally of higher ability than the overall student population. A 5 is the middle of a strong group, and the report draws it as a 4-to-6 band.
Why is my child's percentile so much lower than on school tests?
Because the comparison group is different. A school or state test compares your child with all students; the SSAT compares your child with first-time SSAT takers in the same grade, and the ISEE with all ISEE takers in the same grade, both over three years. The test maker says a result can look considerably lower for that reason alone. Judge the score against the school's range, not against last spring's percentile.
Can we send only the best section scores?
No. The SSAT scores each test date as a whole and does not combine sections across dates, though schools receive scores only for the test dates you designate, so you can send every score from the better test date. The ISEE sends only a complete report and cannot mix sections from two tests. If a later test improved one section, the test maker suggests asking the school whether sending both reports helps.
How many times can my child take the test?
The ISEE allows one test per testing season, up to three in a school year. On the SSAT, Middle and Upper Level students can take the test multiple times per testing year, within limits by test mode: two Prometric center tests, one SSAT at Home, and all the Standard paper dates plus one Flex test. Elementary Level students can take up to two Standard tests and one Flex test per testing year. Our SSAT Elementary Level test dates page lists the dates. Each test produces its own report, and scores can be sent to schools for two testing years.
When will the scores arrive?
ISEE: usually three to five days after an online test and five to ten after a paper test. SSAT: about two weeks after a paper test, the Wednesday after an SSAT at Home test, and the Wednesday after the Sunday that closes the scoring period for a Prometric center test. No SSAT scores are released until a parent completes the Testing Experience Statement in their account.
Will schools know my child tested more than once?
Only through what you send. SSAT schools receive scores for the test dates you designate for them, and nothing from other dates. The ISEE does not share your recipient list with schools, and each school sees only the reports you choose to send it.
Does the essay or writing sample count toward the score?
No. Neither test scores it. The ISEE essay is unscored; schools you share scores with get a copy, and families do not. The SSAT writing sample is unscored on every level; Middle and Upper Level writing samples go to your recipient schools by default, and a parent can buy a copy through the account. Schools read them for writing, not for points.