i-Ready vs MAP: Why the Two Math Scores Do Not Match
Your child has an i-Ready score from one year and a MAP score from another, or your district just switched from one test to the other, and the two math numbers look nothing alike. They are not supposed to.

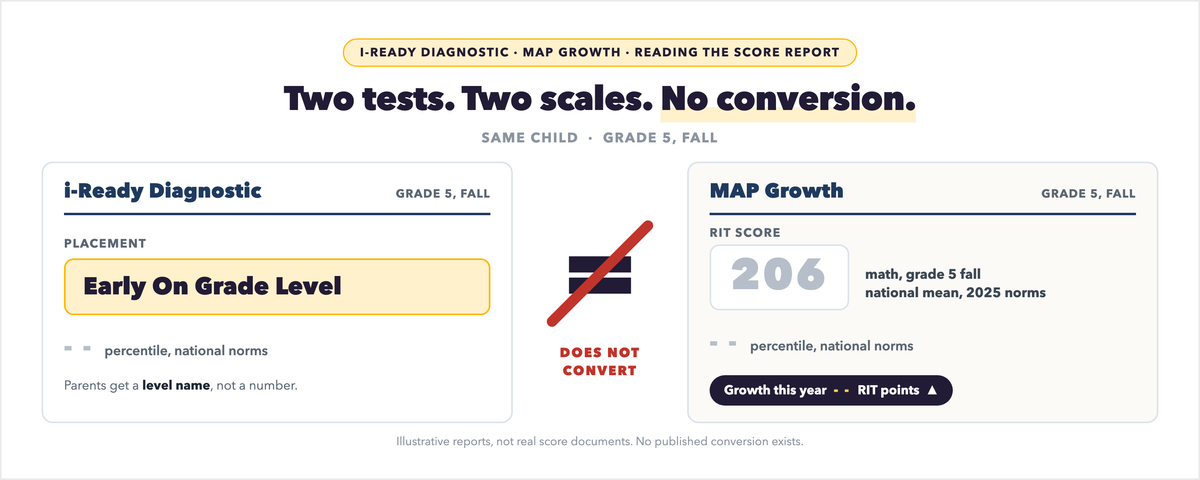
Your child has an i-Ready score from one year and a MAP score from another, or your district just switched from one test to the other, and the two math numbers look nothing alike. They are not supposed to. i-Ready reports a scale score on one scale for every grade, from kindergarten through grade 12, so a kindergartner and an eighth grader sit on the same ruler; the publisher calls it a vertical scale. It then reads that score against placement bands set for your child's grade. MAP Growth, made by NWEA, reports a RIT score on one scale for every grade, so the number is not tied to the grade the child is in. Neither company publishes a table that turns one into the other. The number that decides placement is the one your district names in its own rule. San Jose Unified reads an i-Ready percentile band. Fremont Unified reads an i-Ready scale score. Cupertino Union reads a MAP RIT cut. Three Bay Area districts, three different readings of two tests. These are three California districts, but the method is the same anywhere: find the test name on your own district's placement page.
What each report is actually reporting
i-Ready first. Curriculum Associates makes the i-Ready Diagnostic, which it is renaming i-Ready Inform starting in the 2026-27 school year; your school's report may use either name. The test adapts to each answer, and its score sits on that one scale for every grade. The report reads that one number two ways. The placement level compares the score with a fixed bar (criterion-referenced): the publisher sets scale-score ranges for each grade, and the report's five-level view runs from Mid or Above Grade Level down to Three or More Grade Levels Below. Those ranges hold from fall through spring and did not change between 2024-25 and 2026-27. The national percentile compares your child with other students (norm-referenced): a national sample in the same grade, tested at the same time of year. The report also prints two growth targets, Typical Growth and Stretch Growth, the publisher's own annual benchmarks for a child at that grade and starting level.
MAP next. MAP also adapts to each answer. Its score is a RIT, short for Rasch unit, on a scale NWEA describes as measuring what students know regardless of their grade level. The report pairs the RIT with a percentile from NWEA's norms, built from data on 13.8 million students, and with a growth reading from the same norms. Most schools give it in fall, winter, and spring; some give it twice a year. NWEA's own family guide calls the score one data point among several and tells families to ask for the Family Report.
So a MAP report leads with a RIT and a percentile. An i-Ready report leads with a placement level and a percentile, with the scale score behind both.
Why there is no conversion between them
Three reasons: two from the vendors' own documents, one from a district's own page.
The scales are built separately. Each company sets its scale from its own test items and its own standard setting. i-Ready's placement ranges were set against grade-level expectations with more than 100 teachers. NWEA reads the RIT against its own norms; in the 2025 norms, the average fall RIT for grade 5 math is 206, a national mean, not a bar anyone has to clear. The two numbers on your child's reports sit hundreds of points apart because they are on two different rulers, not because your child did worse on one of them.
The percentiles come from different norm groups and different years. NWEA's current norms are its 2025 set, sampled from 116 million scores across fall 2022 to spring 2024, and NWEA refreshes norms every few years. Curriculum Associates built new post-pandemic norms from more than 5 million students, and it warns districts that new norms can change which students clear a percentile rule for coursework. A percentile can move even when the score does not.
Districts re-set cuts when they switch tests; they do not convert them. In archived cycles, Cupertino Union's accelerated-math cuts were i-Ready scale scores, 548 or higher for Algebra 1 in 7th grade. After the district changed vendors, the same course takes a MAP RIT of 250 or higher, next to the same readiness-test percentages and the same semester-grade rules as before. The bar on the diagnostic changed with the instrument; everything around it stayed.
Which number your district reads
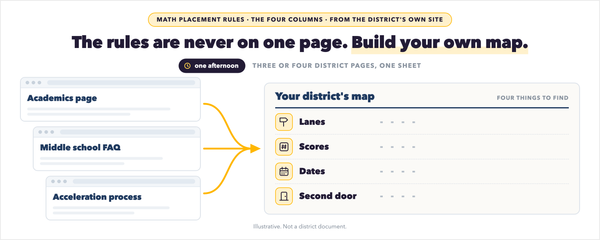
The only reliable answer is on your district's own math placement page. Three verified examples show how differently two tests get used.
| District | Test it names | What it reads | How the rule is written |
|---|---|---|---|
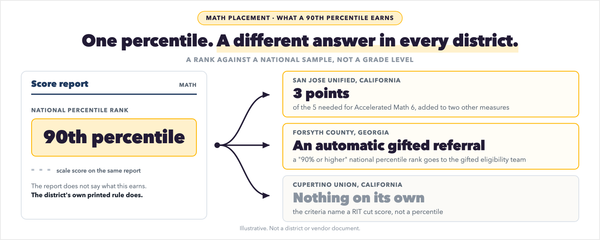
| San Jose Unified | i-Ready Diagnostic (it replaced the NWEA score, MAP Growth, for 2026-27) | The national percentile, grade 5 spring | Points over three measures: Math CAASPP from the last two years (whichever is higher), the grade 5 spring i-Ready Diagnostic percentile (90th = 3 points, 80th = 2, 70th = 1), and the grade 5 winter progress report. Five or more points place a student into Accelerated Math 6; exactly four points earns a challenge assessment |
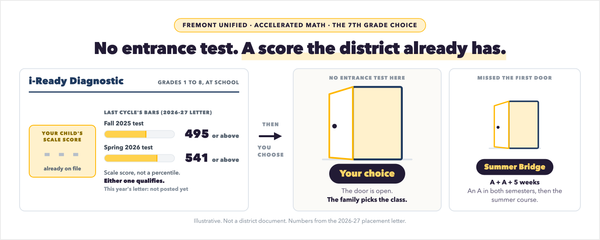
| Fremont Unified | i-Ready Diagnostic | The scale score itself | Families may opt into the accelerated 7th-grade course at 495 or above on the fall 2025 test, or 541 or above on the spring 2026 test |
| Cupertino Union | NWEA MAP | The RIT score | Cut scores by course, 235 for Math 7+ and 250 for Algebra 1 in 7th, each next to a March readiness test, a semester grade, and teacher verification |
A family moving between two of these districts carries a number the next district does not read at all. San Jose's switch matters most if your child tested last year. The 2026-27 criteria put the i-Ready on the same 90th, 80th and 70th percentile bands the earlier cycle used for the NWEA score (MAP Growth). The points stayed the same. The test under them changed. In San Jose the spring i-Ready is the one the district scores, so a fall report is not the report that decides. An appeal can only correct the arithmetic: the criteria doc says administrators do not modify the criteria used for math placement, and it lists private or independent assessments from outside the district among the things it does not consider. The full San Jose table is on our page about MAP scores and placement, and what an i-Ready placement level means is on our page about i-Ready diagnostic scores.
For what the numbers mean in math terms, Cuemath's free concept explanations walk through grade-level math one idea at a time.
Reading the two reports side by side
- Find the test name on the district's placement page before you read either report. If the page names i-Ready, the MAP report is background. If it names MAP, the reverse.
- On the i-Ready report, read the placement level, then the percentile, then the scale score. The publisher shows placements two ways: an absolute placement (the grade level the performance matches) and a relative placement (how far that sits from your child's own grade). A third grader performing like a first grader reads Grade 1 on one and Two Grade Levels Below on the other.
- On the MAP report, read the RIT, the percentile, and the growth line. Fairfax County, for one, tells families to look at all three together.
- Compare the two percentiles only loosely. Never compare the raw scores. If the percentiles are far apart, ask about the date of each test and the norm year behind each report before asking which test is right.
- Ask the school which test counts. San Jose reads the spring test. Fremont reads either the fall or the spring test, with a different cut for each.
Where Cuemath fits
We do not run either test and we cannot move a district's cut score. What the number alone does not tell you is which specific skills sit behind it. A free Cuemath MathFit evaluation is a live, one-on-one session that shows where your child is solid and where a gap sits, whichever test the district reads.
Two scores, one child. See the skills behind the numbers.
A free Cuemath MathFit evaluation is a live, one-on-one session that shows where your child is solid and where a gap sits behind an i-Ready or MAP result.
Book a Free EvaluationFor students in Grades K to 12.
FAQs
Is an i-Ready scale score the same kind of number as a MAP RIT score?
No. Both are scores from adaptive tests, but each company builds its own scale from its own test items. i-Ready's scale score is read against grade-level placement ranges the publisher set with teachers. NWEA's RIT is read against NWEA's norms. Neither company publishes a table that maps one onto the other.
Can I convert my child's i-Ready score into a MAP score, or the other way around?
Neither vendor publishes a conversion, and any chart online that offers one is somebody's estimate, not a vendor document. If your district switched tests, the district sets a new cut on the new test, as Cupertino Union did when its bar for Algebra 1 in 7th grade moved from an i-Ready 548 to a MAP RIT of 250.
Why did my child's percentile change when the score barely moved?
Because the norms behind the percentile changed. NWEA released updated norms in 2025 from scores gathered between fall 2022 and spring 2024. Curriculum Associates introduced new post-pandemic norms and says that they can change which students clear a percentile rule. The scale score or RIT is your child's result; the percentile is that result placed against whichever national sample the vendor is using this year.
Which test does my district use for math placement?
Only your district's placement page can say. Among the districts we verified, San Jose Unified names the i-Ready Diagnostic and reads its percentile in points, Fremont Unified names the i-Ready Diagnostic and reads its scale score, and Cupertino Union names NWEA and reads the RIT. Search the page for the test's name and for the word "score."
Our district switched from MAP to i-Ready this year. Does last year's MAP score still count?
In San Jose Unified, no. The 2026-27 criteria name three measures (CAASPP, the grade 5 spring i-Ready, the winter progress report), and last year's NWEA (MAP Growth) score is not one of them. A student with no spring i-Ready score can take the i-Ready in the summer before 6th grade. Ask the school only to confirm which year's criteria apply to your child. Cupertino Union went the other direction and its old i-Ready cut scores are no longer on its page.
Is one test harder than the other?
Neither scale answers that. Both tests adapt to each answer, so every child sees questions near their own level, and neither score is a percentage correct. A low-looking number on one and a high-looking number on the other usually means you are reading two rulers, not two performances.
What are Typical Growth and Stretch Growth on the i-Ready report, and does MAP have the same thing?
Typical Growth is the average annual growth for a student at that grade and placement level on the baseline test. Stretch Growth is an ambitious but attainable annual growth level that puts a below-grade-level student on a path toward proficiency. MAP's growth reading comes from NWEA's conditional growth percentiles, which describe typical growth for students at different starting points. Each is its own vendor's target; they do not map onto each other.