Absolute value graph
In this mini-lesson, we will explore the world of Absolute Value Graph. The journey will take us through types of absolute value graphs, how to plot them, their range and domain, and how to shift them along the axes. You can check out the interactive calculator to know more about the lesson and try your hand at solving a few interesting practice questions at the end of the page.
In mathematics, functions play a very crucial role because it captures the relation between one quantity with the other.
As we go along we learn how to work around graphs of the absolute value function.
The graph has an elbow in the middle as shown by Frank.

Whenever you notice an elbow like this in any graph, the function likely involves an absolute value.
So, let's start plotting these graphs.
Lesson Plan
What Is an Absolute Value Graph?
The graph of an absolute value function is called an absolute value graph.
We define absolute value function \(f:\mathbb{R}\rightarrow \mathbb{R}\) as:
\[f(x)=|x|\]
This is how the graph of absolute value function looks like.
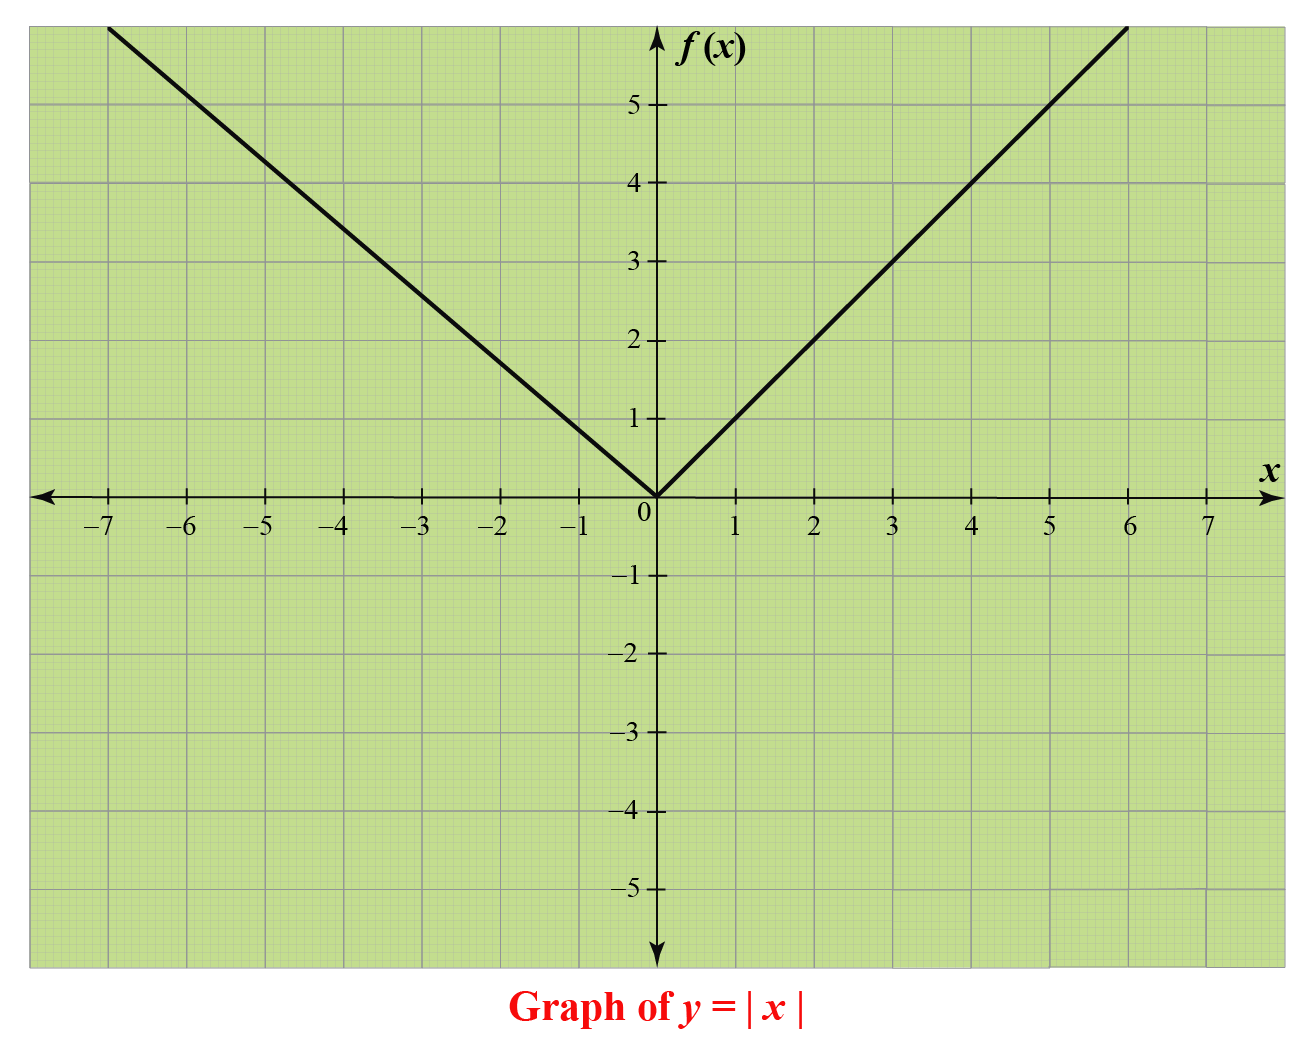
The absolute value function is also called the modulus function.
An alternative way to express the function is,
| \[|x|=\left\{\begin{array}{r} x \quad \text { if } x \geq 0 \\ -x \quad \text { if } x<0 \end{array}\right.\] |
Domain and Range of Absolute Value Function
The function is defined for all real numbers.
For \(x\geq 0\), \(f(x)\) returns the same value, that is, \(x\).
For \(x < 0\), \(f(x)\) returns the negative of the value of \(x\).
So, we arrive at the conclusion that the domain and range of absolute value function are \(\mathbb{R}\) and [0, \infty).
How to Graph Absolute Value Functions?
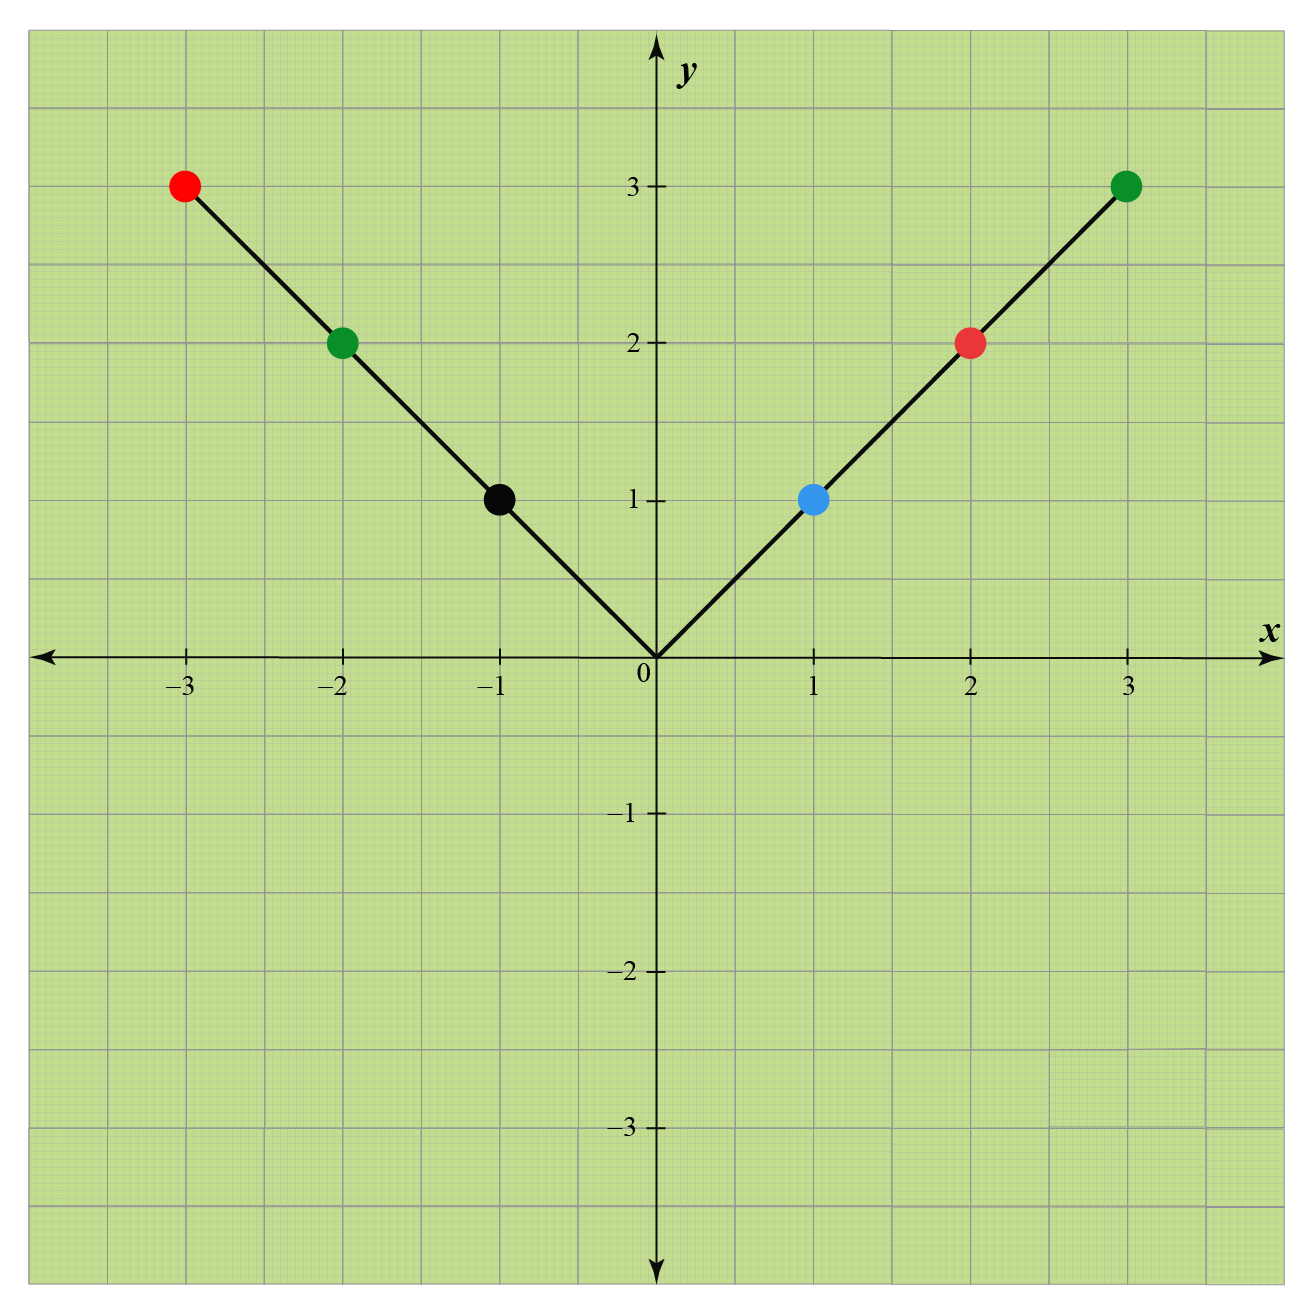
Let's plot the graph of the absolute value function.
We will choose the values of \(x\) from -3 to 3
| \(x<0\) | \(x\geq0\) | ||||||
|---|---|---|---|---|---|---|---|
| \(x\) | -3 | -2 | -1 | 0 | 1 | 2 | 3 |
| \(f(x)=|x|\) | 3 | 2 | 1 | 0 | 1 | 2 | 3 |
How to Vertically Shift Absolute Value Function on a Graph?
Let the equation of absolute value function be \(f(x)=|x|\).
To shift a graph of absolute value function vertically use the new function given by \(g(x)=f(x)+k\).
If the value of \(k\) is positive, then the graph of \(f(x)\) will move vertically up by \(k\) units.
If the value of \(k\) is negative, then the graph of \(f(x)\) will move vertically down by \(k\) units.
Example
Look at the graph of \(g(x)=f(x)+2\)
Did you notice that it has been shifted 2 units up from the graph of \(f(x)=|x|\)?
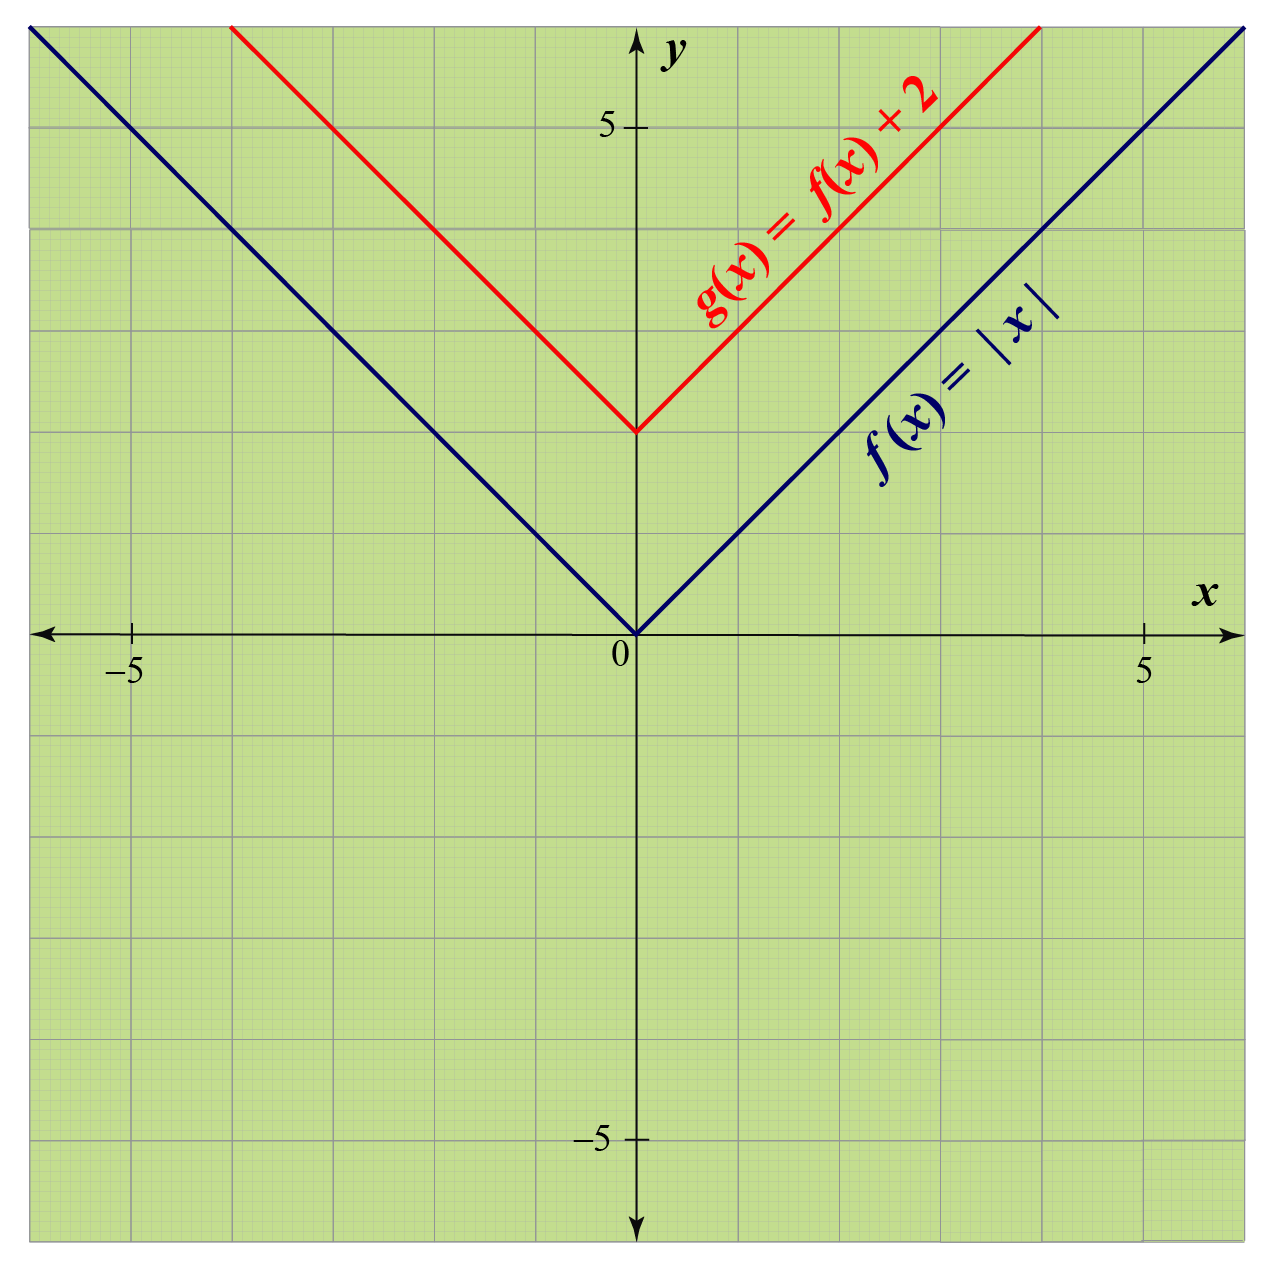
Basically, it is a translation of the graph of the function \(f(x)=|x|\).
Here is a calculator for the absolute value graph.
Experiment with the simulation below to observe the vertical shifts on the graph of the absolute value function.
How to Horizontally Shift Absolute Value Function on a Graph?
Let the equation of absolute value function be \(f(x)=|x|\).
To shift a graph of absolute value function horizontally, use the new function given by \(g(x)=f(x+h)\).
If the value of \(h\) is positive, then the graph of \(f(x)\) will move horizontally right by \(h\) units.
If the value of \(h\) is negative, then the graph of \(f(x)\) will move horizontally left by \(h\) units.
Example
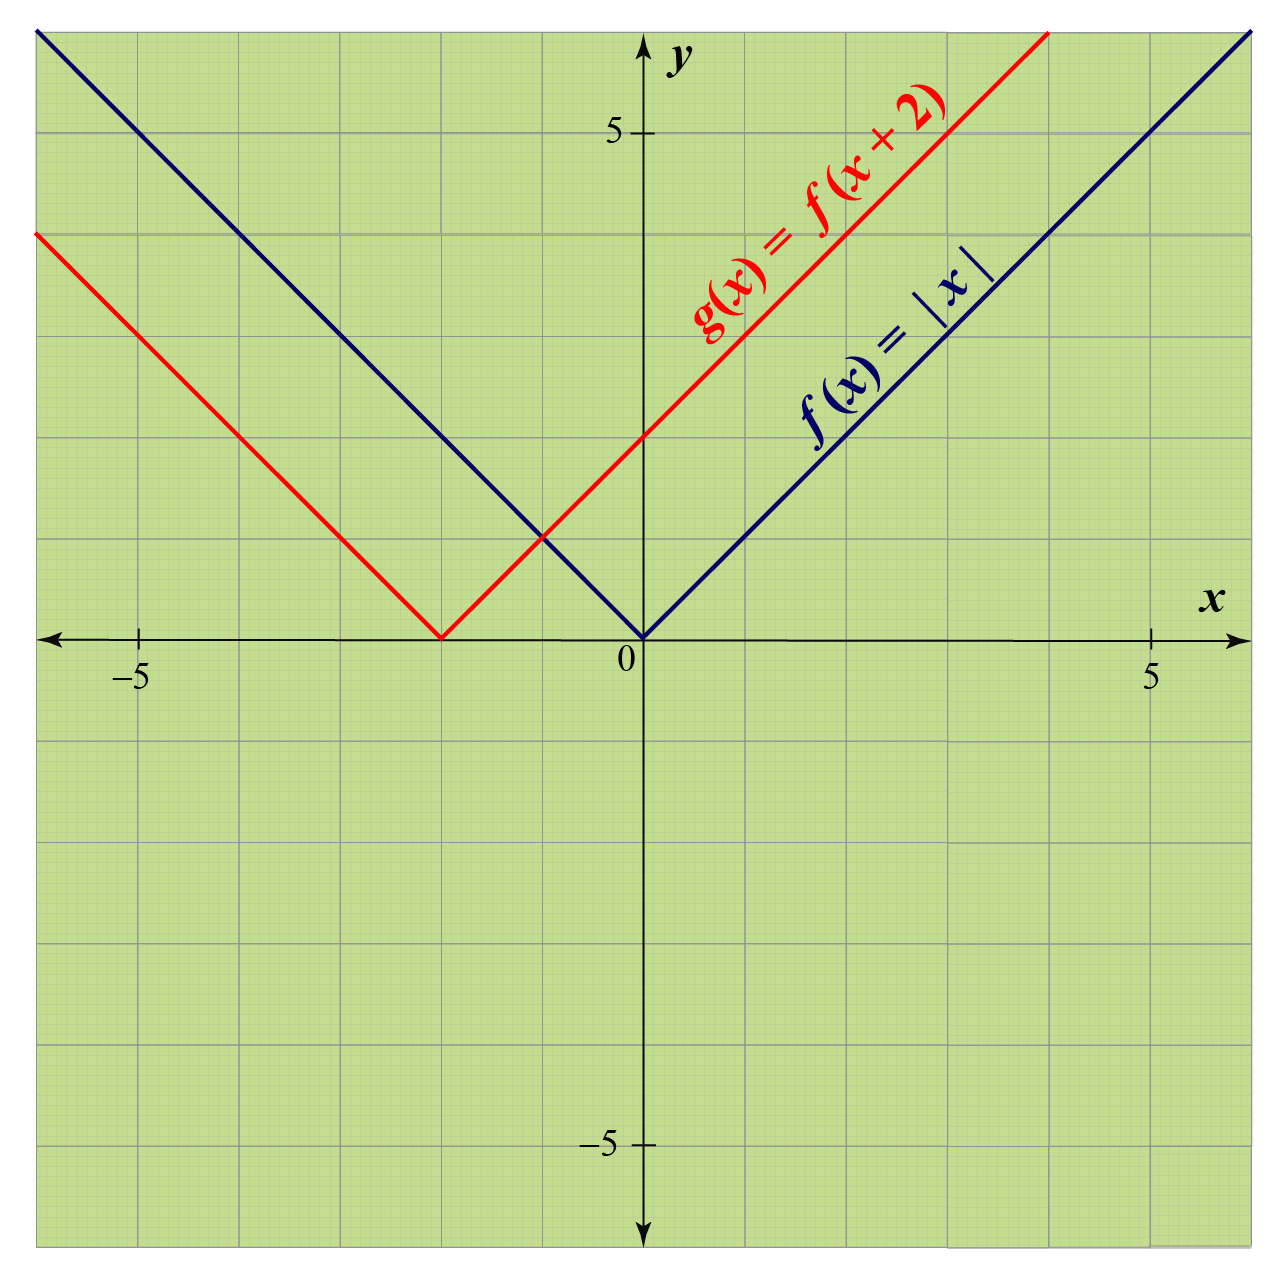
Consider the graph of \(g(x)=f(x+2)\)
Observe that it has been shifted 2 units right from the graph of \(f(x)=|x|\).
Experiment with the simulation below to observe the horizontal shifts on the graph of the absolute value function.
We hope this another calculator for the absolute value graph helped you observe the shifts in the graph.

-
The absolute value graph depicts the distance of a number from the origin.
-
The graph of the absolute value function is symmetric about the \(y\)-axis.
-
The graph of the absolute value function makes a right angle at the origin.
-
Absolute value function is an even function because \(f(x)=f(-x)\).
Solved Examples
| Example 1 |
Frank took three positive \(x\) values to plot the graph of the function given by \(f_{1}(x)=|x+2|\)
The values are given as follows:
| \(x\) | 0 | 1 | 2 |
| \(f_{1}(x)=|x+2|\) | 2 | 3 | 4 |
He plotted these three points on a graph and joined the points.
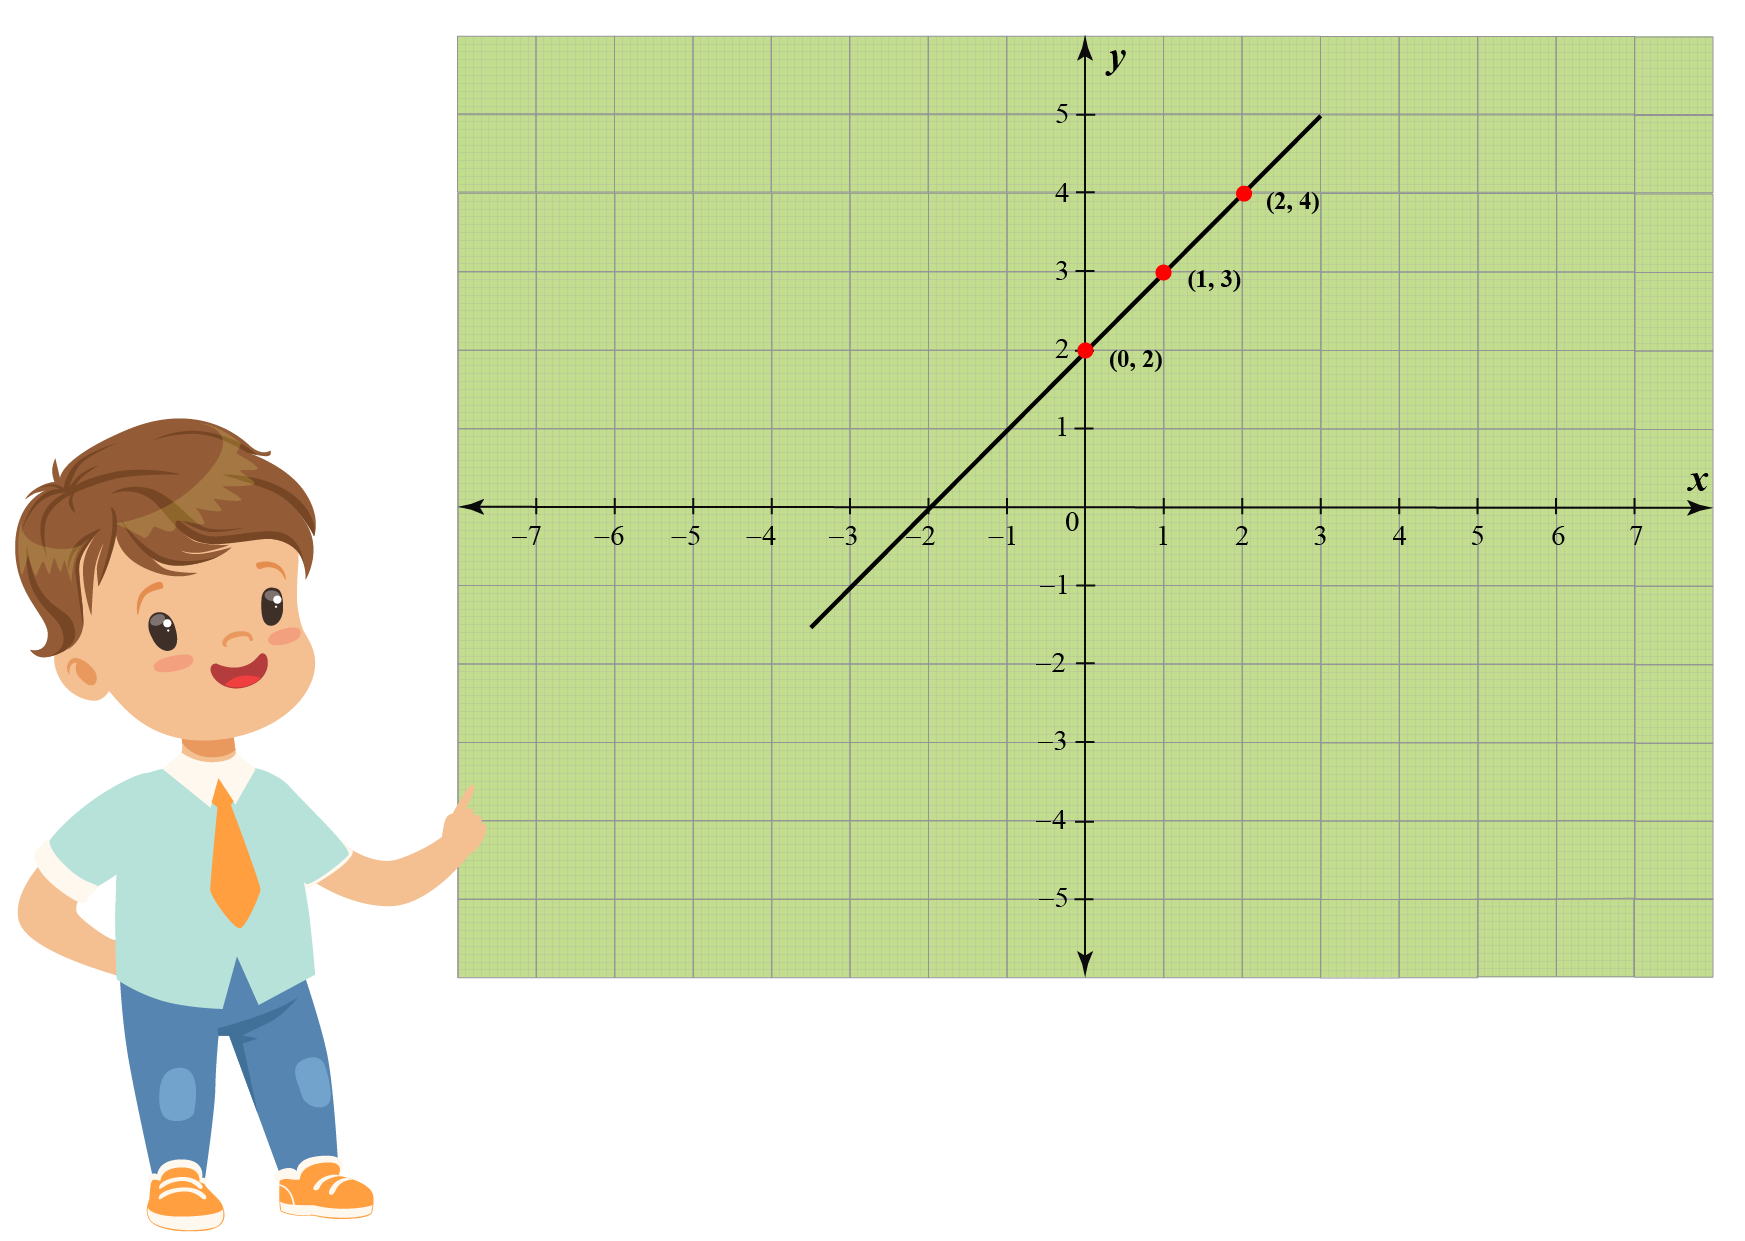
Did he plot the graph of the function \(f_{1}(x)\) correctly?
Solution
No, Frank did not correctly plot the graph because the absolute value function takes into account the absolute values of numbers.
The function returns the non-negative values for every negative input.
Let's a few negative integers and evaluate the value of the function at those points.
| \(x<0\) | \(x\geq0\) | ||||||
|---|---|---|---|---|---|---|---|
| \(x\) | -5 | -3 | -1 | 0 | 1 | 2 | 3 |
| \(f(x)=|x+2|\) | 3 | 1 | 1 | 2 | 3 | 4 | 5 |
Now, plot these points on the graph and join them to obtain the required graph.
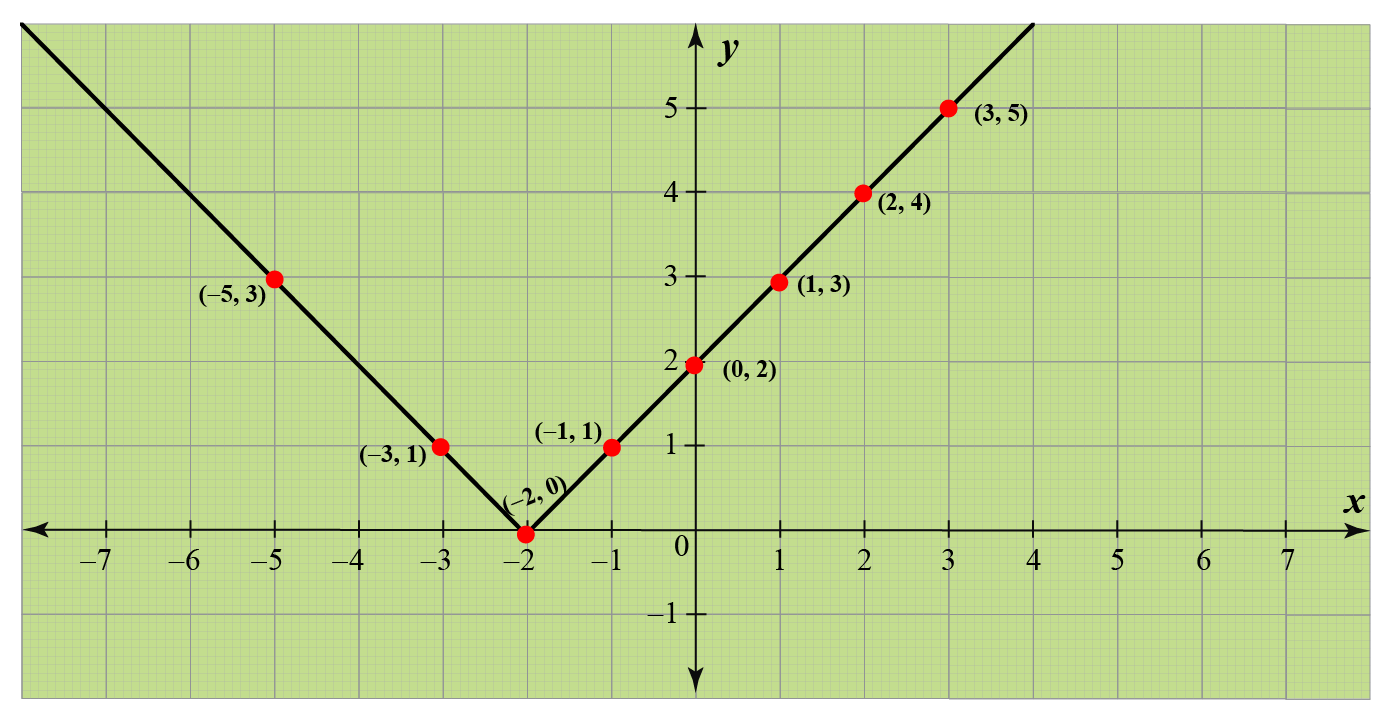
| So, the correct graph of the function \(f_{1}(x)\) is shown. |
| Example 2 |
Can you help James plot the graph of \(f_{2}(x)=-|x+2|\) using the help of \(f_{1}(x)=|x+2|\)?
Solution
The function \(f_{2}(x)\) is the negative of the function \(f_{1}(x)=|x+2|\).
So, let's take the same points we used for the previous example and change the sign of each number in the last row.
| \(x<0\) | \(x\geq0\) | ||||||
|---|---|---|---|---|---|---|---|
| \(x\) | -5 | -3 | -1 | 0 | 1 | 2 | 3 |
| \(f_{2}(x)=|x+2|\) | -3 | -1 | -1 | -2 | -3 | -4 | -5 |
Now, plot these points on the graph and join them to obtain the required graph.
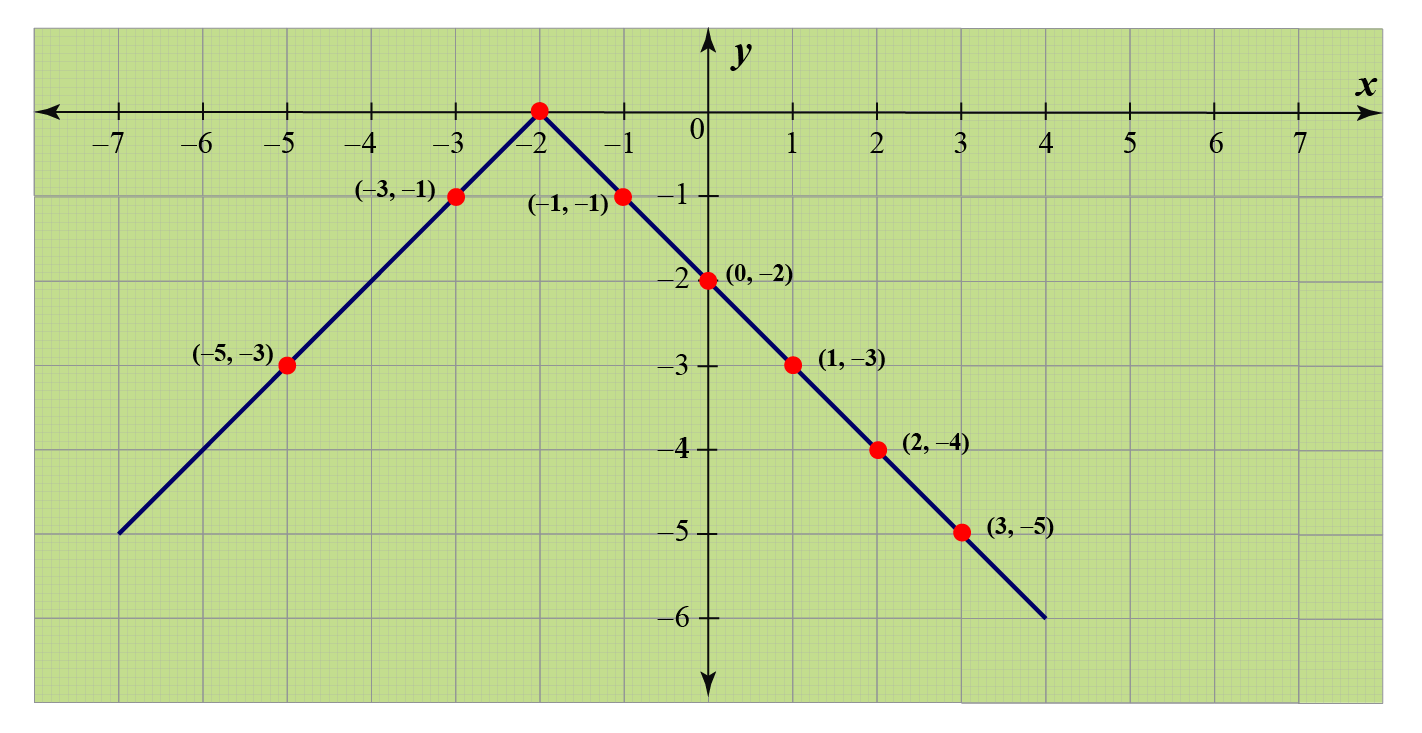
| So, we obtained the graph of \(f_{2}\). |
| Example 3 |
Plot the graph of \(f_{3}(x)=2|x-3|+4\)
Explain the shifts in the graph.
Solution
According to the definition of the absolute value function, if \(x-3\geq0\), then \(|x-3|=x-3\) and if \(x-3<0\), then \(|x-3|=-(x-3)\)
So, the function \(f_{3}(x)\) can be expressed as
\[2|x-3|+4=\left\{\begin{array}{r}
2x-2 \quad \text { if } x \geq 3 \\
10-x \quad \text { if } x<3
\end{array}\right.\]
The graph is shown below.
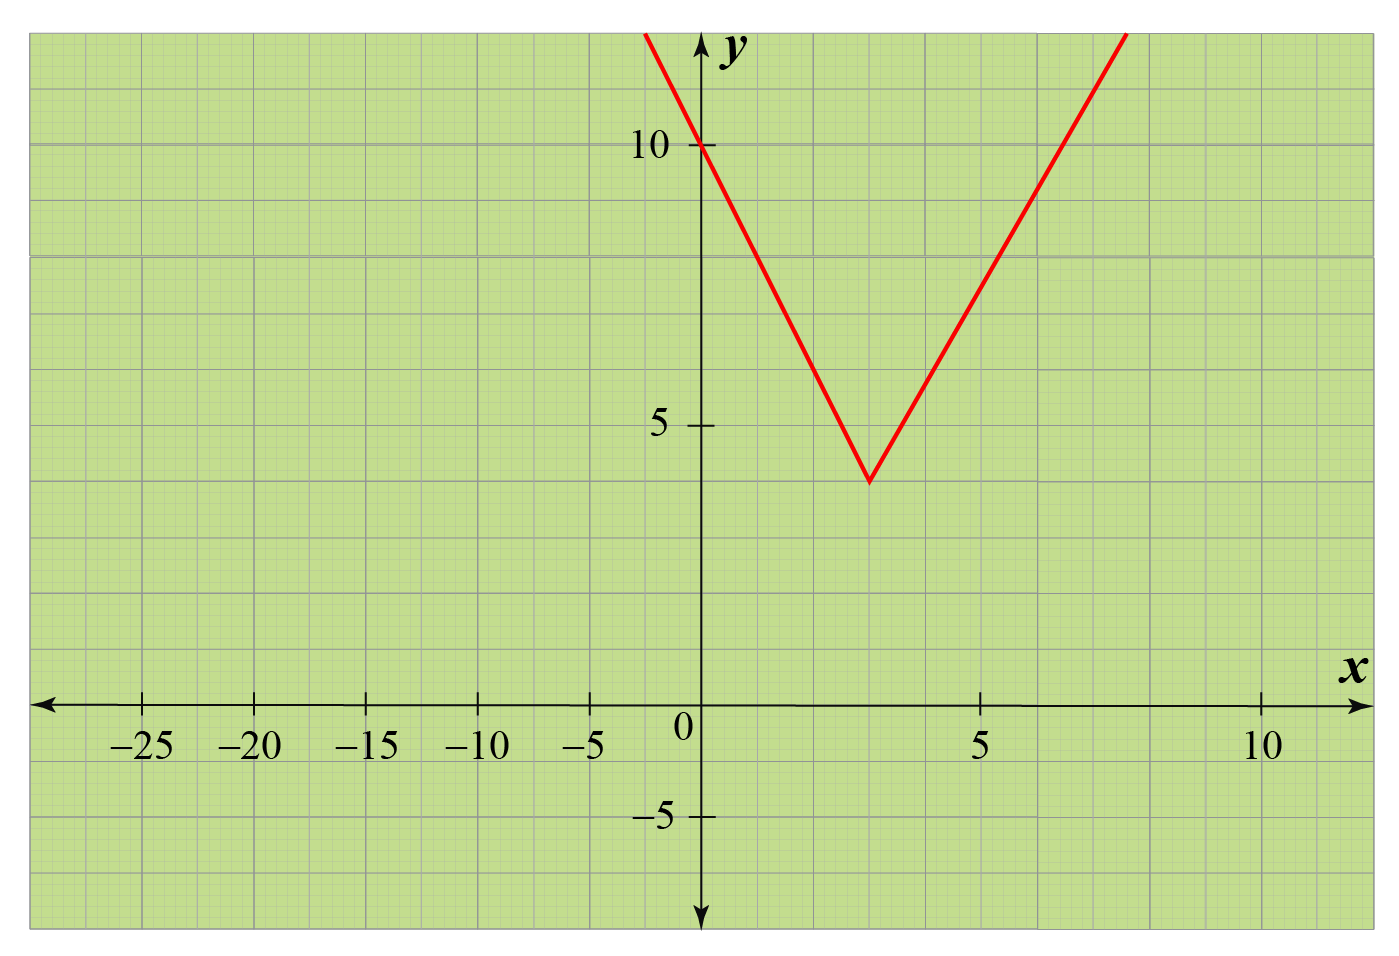
| So, we obtained the graph of \(f_{3}\). |
| Example 4 |
Here is a function that uses the absolute value.
It is given as \(f_{4}(x)=\left\{\begin{matrix}\frac{|x|}{x},&\;x\neq0\\0,&\;x=0\end{matrix}\right.\)
This is the signum function.
Can you plot the graph of this function?
Solution
We already know that the absolute value function returns non-negative values for all real numbers.
When \(x> 0\), then we have \(f_{4}(x)=\frac{|x|}{x}=\frac{x}{x}=1\)
When \(x < 0\), then we have \(f_{4}(x)=\frac{|x|}{x}=-\frac{x}{x}=-1\)
So, the signum function can also be given as:
\[f_{4}(x)=\left\{\begin{matrix}1,&\;x>0\\0,&\;x=0\\-1,&\;x<0\end{matrix}\right.\]
Now, we can easily plot the graph.
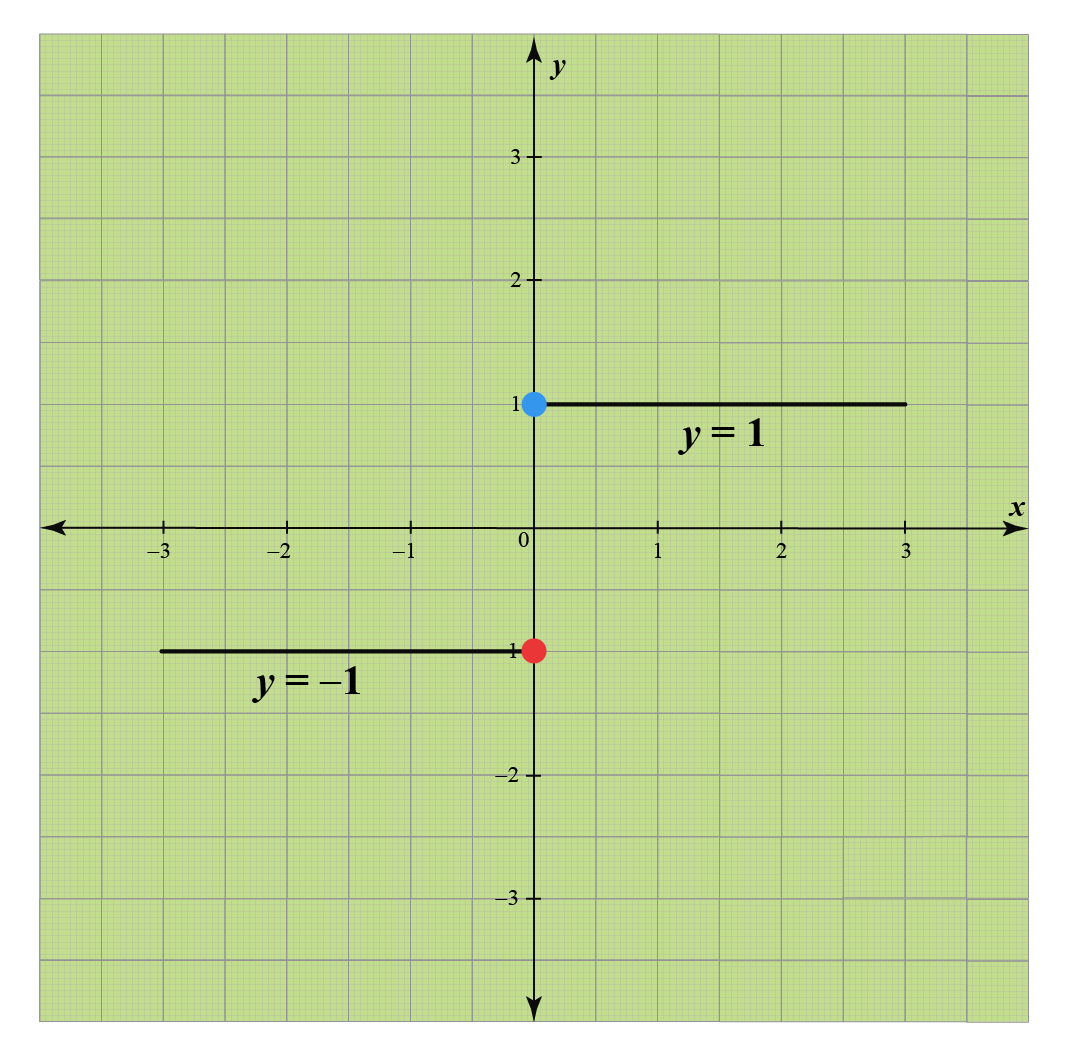
| Hence, we have a graph of the signum function. |

- How will the graph of the function \(h(x)=a|x|\) look like?
What will happen if \(a\) is negative? - How does the graph of the function \(f_{4}(x)=\left\{\begin{matrix}\frac{x}{|x|},&\;x\neq0\\0,&\;x=0\end{matrix}\right.\) looks like? Is it similar to the graph of signum function?
Interactive Questions
Here are a few activities for you to practice.
Select/type your answer and click the "Check Answer" button to see the result.
Let's Summarize
We hope you enjoyed learning about the Absolute Value Graph with the examples and practice questions. Now, you will be able to easily solve problems on the examples on the calculator for Absolute Value Graph, domain and range of absolute value function, and equations of the absolute value function.
About Cuemath
At Cuemath, our team of math experts is dedicated to making learning fun for our favorite readers, the students!
Through an interactive and engaging learning-teaching-learning approach, the teachers explore all angles of a topic.
Be it worksheets, online classes, doubt sessions, or any other form of relation, it’s the logical thinking and smart learning approach that we, at Cuemath, believe in.
Frequently Asked Questions (FAQs)
1. How do you graph a double absolute value function?
Follow the steps mentioned below to plot a graph of the double absolute value function.
Separate cases of the function on which the function is defined.
For each domain, plot the graph of the function.
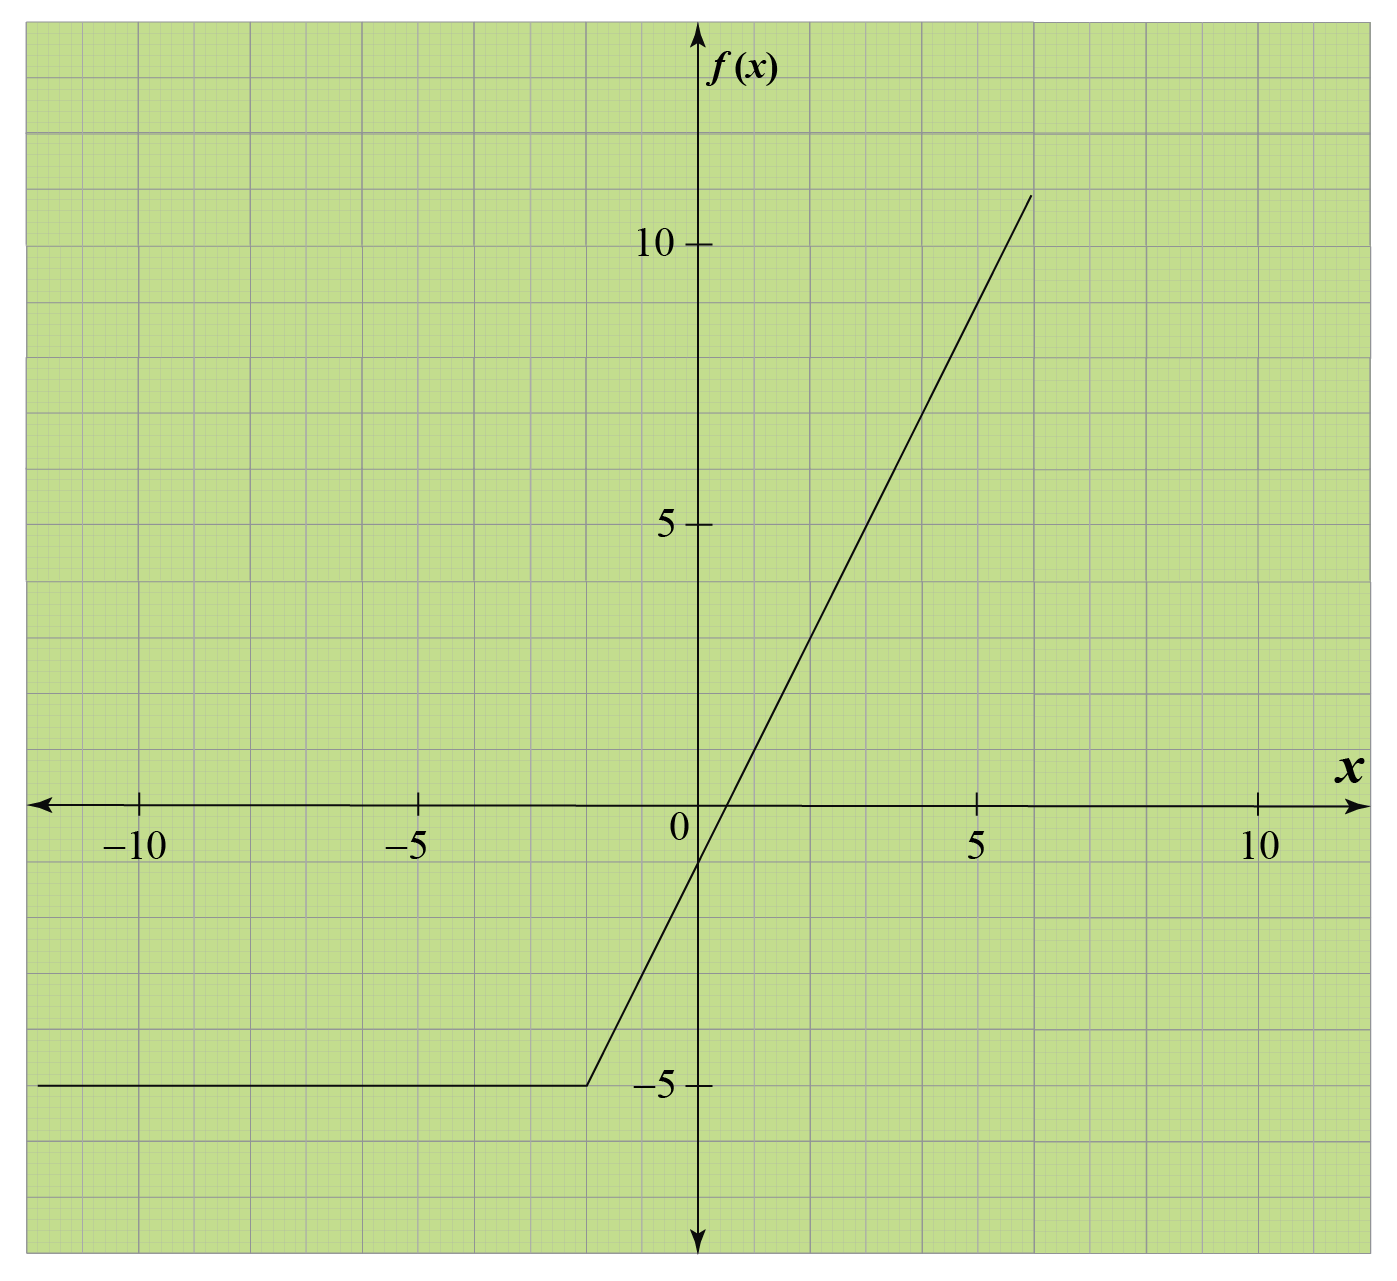
For example, \(f(x)=|x+2|+x-3\)
According to the definition of the absolute value function, if \(x+2\geq0\), then \(|x+2|=x+2\) and if \(x+2<0\), then \(|x+2|=-(x+2)\)
So, the function \(f(x)\) can be expressed as
\[|x+2|+x-3\\=\left\{\begin{array}{r}
2x-1 \quad \text { if } x \geq -2 \\
-5 \quad \text { if } x<-2
\end{array}\right.\]
The graph is shown below.
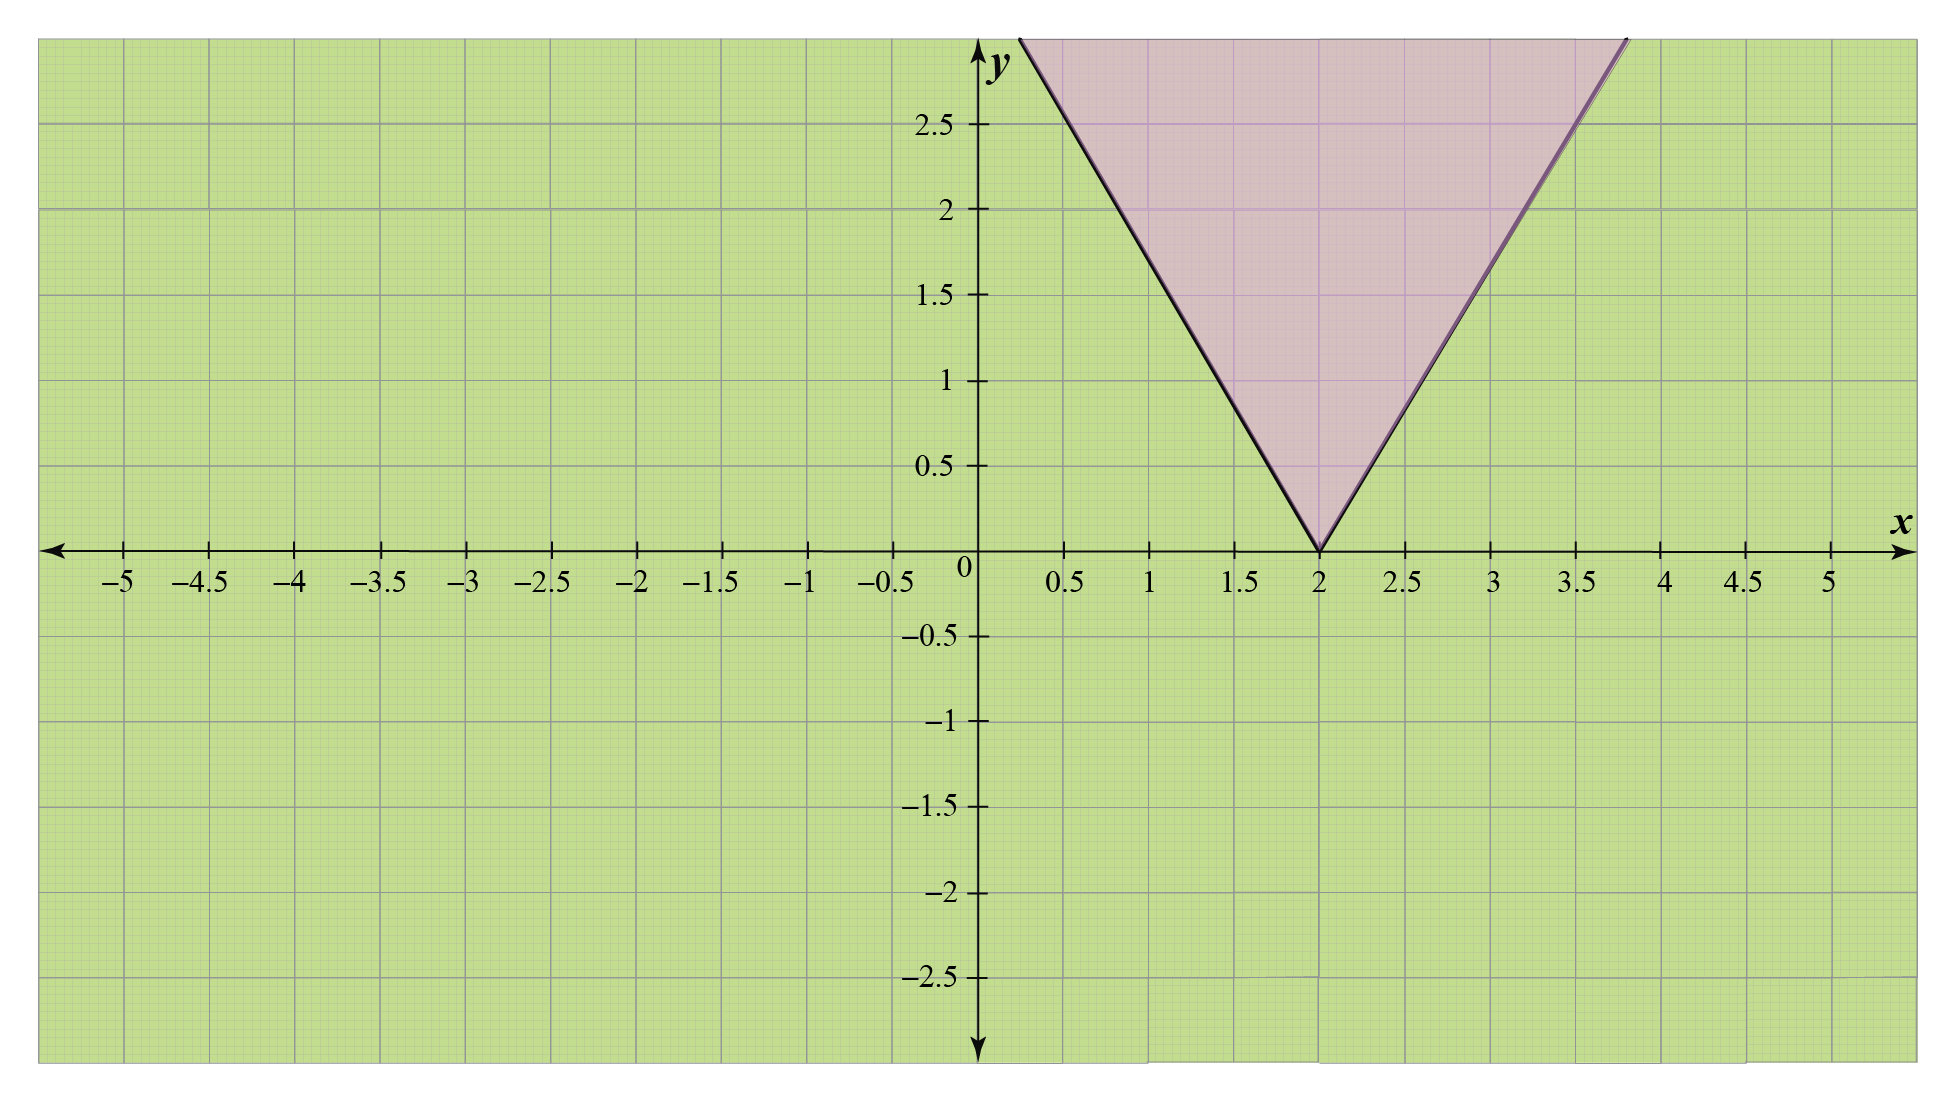
2. How do you graph an absolute value inequality with two variables?
The primary thing to remember while plotting graphs for absolute value inequality is that the graphs of absolute value are "V" shape.
We will set up a table and choose some \(x\) values to evaluate the value of the equality function at those points.
Suppose we have inequality \(y>|x-2|\).
Let's set up a table and calculate the values of \(y=|x-2|\).
| \(x<0\) | \(x\geq0\) | |||||
|---|---|---|---|---|---|---|
| \(x\) | -2 | -1 | 0 | 1 | 2 | 3 |
| \(y>|x-2|\) | 4 | 3 | 2 | 1 | 0 | 1 |
Since we have to draw a graph for inequality, we take a dotted line.
Now we need to shade on side of this line.
We will plug in the \(x\) and \(y\) values and see if we get true or false.
Let's pick the point (0,0).
The point (0,0) does not satisfy the inequality \(y>|x-2|\).
So, the graph is given as
- Live one on one classroom and doubt clearing
- Practice worksheets in and after class for conceptual clarity
- Personalized curriculum to keep up with school